. 2017 Apr 12:7:46433.
doi: 10.1038/srep46433.

Regulation of miR163 and its targets in defense against Pseudomonas syringae in Arabidopsis thaliana

Affiliations

Regulation of miR163 and its targets in defense against Pseudomonas syringae in Arabidopsis thaliana

Hiu Tung Chow et al. Sci Rep. .

Abstract

Small RNAs are important regulators for a variety of biological processes, including leaf development, flowering-time, embryogenesis and defense responses. miR163 is a non-conserved miRNA and its locus has evolved recently through inverted duplication of its target genes to which they belong to the SABATH family of related small-molecule methyltransferases (MTs). In Arabidopsis thaliana, previous study demonstrated that miR163 accumulation was induced by alamethicin treatment, suggesting its roles in defense response pathways. Enhanced resistance against Pseudomonas syringae pv. tomato (Pst) was observed in the mir163 mutant, whereas transgenic lines overexpressing miR163 showed increase sensitivity to Pst, suggesting that miR163 is a negative regulator of defense response. Elevated level of miR163 and its targets in A. thaliana were observed upon Pst treatment, suggesting a modulating relationship between miR163 and its targets. In addition, miR163 and histone deacetylase were found to act cooperatively in mediating defense against Pst. Transgenic plants overexpressing miR163-resistant targets suggested their different contributions in defense. Results from this study revealed that the stress-inducible miR163 and its targets act in concert to modulate defense responses against bacterial pathogen in A. thaliana.


Conflict of interest statement

The authors declare no competing financial interests.

Figures

Figure 1
Figure 1. miR163 is involved in defense against Pseudomonas syringae (Pst).
(a) Disease symptoms in mature leaves from 3–4 weeks old Arabidopsis thaliana (Col-0 and the mir163 mutant; CS879797) before inoculation (untreated) and at 3 days post-inoculation (3 dpi) with virulent Pseudomonas syringae pv. tomato DC3000 (Pst DC3000). Inoculation was performed using 5 × 105 cfu/mL (OD600 = 0.001) of bacteria through syringe infiltration. Scale bar = 1 cm. (b) Bacterial growth in leaves were determined at 0 and 3 dpi. Error bars indicate the standard deviation from 3 replicates. Same letters denote no statistical differences among means from the replicates as calculated by ANOVA with Tukey-Kramer post hoc test (α = 0.05). (c) Disease symptoms of transgenic lines overexpressing the pri-miR163 in Col-0 and the mir163 mutant before inoculation (untreated) and at 3 dpi with Pst, respectively. Disease symptoms of the corresponding empty vector control line were showed. Scale bar = 1 cm. (d) Bacterial growth analysis in transgenic lines inoculated with Pst at 0 and 3 dpi. Bacterial treatment was performed as in (b). Same letters denote no statistical differences among means from three biological replicates as calculated by ANOVA with Tukey-Kramer post hoc test (α = 0.05).
Figure 2
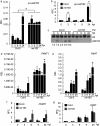
Figure 2. Pst induced expression of miR163 and its targets.
(a,b) Time course expression of pri-miR163 in Col-0 and the mir163 mutant after dipping treatment with 2 × 108 cfu/mL (OD600 = 0.4) of Pst DC3000. Infected leaves from 4 plants were collected at the indicated hours post-inoculation (hpi) for RNA extraction and gene expression analyses. (a) The relative expression level (REL) of pri-miR163 was calculated using EF1α as a control. (b) Upon induction, the relative fold change (RFC) of pri-miR163 at different time point was compared to that at 0 hpi. Values are mean ± standard error (n = 3). (c) Temporal miR163 accumulation at 0, 3, 6, 9 and 24 hpi in Col-0 and the mir163 mutant upon infection with Pst DC3000 were detected using small RNA gel blot analyses. The corresponding U6 signals (endogenous controls) were detected in the same blot. Densitometric analysis was performed using ImageJ software and the miR163 signals were normalized against U6. The relative fold change of miR163 was showed at the bottom. Experiments were performed twice with similar results. (d–g) Expression of two miR163 targets, PXMT1 (d) and FAMT (e), in mature leaves of Col-0 and the mir163 mutant before (0) and at 3, 6, 9, 24 hpi with Pst DC3000. The relative expression level (REL) of PXMT1 and FAMT was calculated using EF1α as a control. (f,g) Relative fold change (RFC) of the targets at various time points upon Pst treatment was compared against 0 hpi. Values are mean ± standard error (n = 3). Asterisks indicate significant differences between 0 hpi and the indicated time using Student’s t-test (P < 0.05). “+” signs indicate significant differences (Student’s t-test; P < 0.05) between Col-0 and the mir163 at the indicated time point.
Figure 3
Figure 3. Expression of defense responsive gene in the Col-0 and mir163 mutant upon Pst DC3000 infection.
qRT-PCR of NPR1 (a,b) and PR1 (c,d) expression in Col-0 and the mir163 mutant before (0) and at 1, 2, 3 days post-inoculation (dpi) with the virulent Pst DC3000. Inoculation was performed using 5 × 105 cfu/mL (OD600 = 0.001) of bacteria through syringe infiltration. The relative expression level (REL) of NPR1 (a) and PR1 (c) was normalized against EF1α expression. In addition, the relative fold change (RFC) of NPR1 (b) and PR1 (d) at various time points upon Pst treatment was compared against 0 hpi. Values are mean ± standard error (n = 3). Asterisks indicate significant differences between 0 hpi and the indicated time within the genotype using Student’s t-test (P < 0.05). “+” signs indicate significant differences (Student’s t-test; P < 0.05) between Col-0 and the mir163 at the indicated time point.
Figure 4
Figure 4. miR163 and HDAC act cooperatively in defense against Pst DC3000.
(a) Wild type (Col-0), the mir163 mutant, the hda19 mutant (SALK_139445) and homozygous mir163 hda19 double mutant (DM) were infiltrated with a suspension of Pst DC3000 (OD600 = 0.001 in 10 mM MgCl2; 5 × 105 cfu/mL). Leaves from 4 plants were harvested and bacterial growth in leaves was determined at 0 and 3 days post inoculation (dpi). Error bars indicate the standard deviation from 3 replicates. Same letters denote no statistical differences among means as calculated by ANOVA with Tukey-Kramer post hoc test (α = 0.05). Pictures from representative plant were taken at 0 and 3 dpi. Scale bar = 1.5 cm. (b) Mature leaves were collected at 0 (untreated) and 24 hours post inoculation (hpi) upon Pst DC3000 inoculation for RNA isolation and cDNA synthesis. miR163 accumulation in various plant lines were detected using small RNA gel blot analysis. The corresponding U6 signals were detected in the same blot. Densitometric analysis was performed using ImageJ software and the miR163 signal was normalized against U6. The relative fold differences (bottom) of miR163 were compared against Col-0 at untreated condition. (c,d) Expression of PXMT1 (c) and FAMT (d) were detected using qRT-PCR at 0 and 24 hpi. Values are mean ± standard error (n = 3). Difference in expression between lines at 0 and 24 hpi were calculated using Student’s t-test (P < 0.05). Same letters denote no statistical differences among means.
Figure 5
Figure 5. Pst-induced chromatin changes at the MIR163, PXMT1 and FAMT loci.
(a) Schematic diagrams of the MIR163, PXMT1 and FAMT loci showing the upstream regions and target amplicons (open boxes) for ChIP DNA analyses. Positions flanking each amplicon are indicated. (b–d) Mature plants were treated with virulent Pst DC3000 and samples were collected at 0 and 6 hours post inoculation (hpi) for ChIP. Inoculation was performed using 2 × 108 cfu/mL (OD600 = 0.4) of bacteria through dipping inoculation. Antibodies against H3K9ac, H3K4me3 and H3 C-ter were used in ChIP. Relative enrichment (R.E.) of ChIP DNA were quantified using qPCR and normalized against input DNA at the MIR163 (b), PXMT1 (c) and FAMT (d) loci, respectively. Values are mean ± standard error from three biological replicates. Asterisks indicate significant differences (Student’s t-test; P < 0.05) when compared to the corresponding sample at 0 hpi. “+” signs indicate significant differences at P < 0.1 (Student’s t-test) when compared to the corresponding sample at 0 hpi.
Figure 6
Figure 6. FAMT overexpressors and mutant are sensitive to Pst infection.
(a,b) Mature plants were inoculated with Pst DC3000 (5 × 105 cfu/mL; OD600 = 0.001) through syringe infiltration. (a) Bacterial growth in leaves was determined at 0 and 3 days post-inoculation (dpi). Error bars indicate the standard deviation from 3 replicates. Same letters denote no statistical differences among means from the replicates as calculated by ANOVA with Tukey-Kramer post hoc test (α = 0.05). (b) Plant phenotypes and disease symptoms of 4-week-old leaves at 0 and 3 dpi. Scale bar = 2 cm. Col-0, wild type A. thaliana; vector, transgenic line contains empty vector transgene; 35S-FAMT, transgenic line contains 35S-driven myc-tagged FAMT transgene; 35S-mFAMT, transgenic line contains the 35S-driven myc-tagged mFAMT transgene (the miR163 target site is mutated); and famt, the homozygous famt (SALK_119380) T-DNA insertion mutant. (c,d) Total RNA was isolated from the mature leaves at 0 and 24 hours post-inoculation (hpi). Expression of the endogenous and transgene FAMT transcripts (c) and the myc-tagged transcripts (d) were determined using qRT-PCR with primers targeting the gene region of FAMT and the myc-tag, respectively. The relative expression level (REL) was normalized against EF1α expression. Values are mean ± standard error (n = 3). Same letters denote no statistical differences (Student’s t-test; P < 0.05) from three biological replicates.
Figure 7
Figure 7. Transcript and protein accumulation in the FAMT overexpressors.
(a) Semi-quantitative RT-PCR and cleaved amplified polymorphic sequences (CAPS) analyses were used to detect the overexpressed FAMT and mFAMT in various transgenic lines. Mature leaves were inoculated with Pst DC3000 (5 × 105 cfu/mL) through syringe infiltration and samples were collected at 0 and 24 hpi for gene expression analyses. cDNA were digested with ApoI to determine the relative level of FAMT and mFAMT in the transgenic lines. EF1α expression was used as a control. Densitometry quantification of the transcripts was performed using ImageJ. The relative FAMT (1047 bp) and mFAMT (781 bp) intensities in various lines were compared against that in the vector control at 0 hpi. (b,c) Total leaf protein from leaves of overexpressors were extracted at 0 hpi (b) and after 24 hpi (c) upon Pst DC3000 treatment. Proteins were resolved in 15% SDS-PAGE for western blot analyses using antibody against the c-Myc epitope tag. CBS, Coomassie blue stained. (d,e) The FAMT or mFAMT overexpressor in Col-0 background was backcrossed to the mir163 mutant. Homozygous FAMT or mFAMT overexpressor lines in the mir163 ecotype background were selected for western blot analyses. Total leaf protein from leaves of overexpressors were extracted at 0 hpi (d) and after 24 hpi (e) upon Pst DC3000 treatment. Total proteins were resolved in 15% SDS-PAGE and western blot was performed using antibody against the c-Myc epitope tag. (f) A simplified model for miR163 and its targets regulation in plant defense. Relative thickness of lines represents the strength of activation or repression.

References

    1. Brodersen P. & Voinnet O. The diversity of RNA silencing pathways in plants. Trends in Genet 22, 268–280 (2006). - PubMed
    1. Katiyar-Agarwal S. & Jin H. Role of small RNAs in host-microbe interactions. Annu Rev Phytopathol 48, 225–246 (2010). - PMC - PubMed
    1. Khraiwesh B., Zhu J.-K. & Zhu J. Role of miRNAs and siRNAs in biotic and abiotic stress responses of plants. Biochim Biophys Acta 1819, 137–148 (2012). - PMC - PubMed
    1. Liu H. H., Tian X., Li Y. J., Wu C. A. & Zheng C. C. Microarray-based analysis of stress-regulated microRNAs in Arabidopsis thaliana. RNA 14, 836–843 (2008). - PMC - PubMed
    1. Sunkar R., Li Y.-F. & Jagadeeswaran G. Functions of microRNAs in plant stress responses. Trends Plant Sci 17, 196–203 (2012). - PubMed

Publication types

MeSH terms