. 2018 Jan;11(1):97-111.
doi: 10.1038/mi.2017.24. Epub 2017 Apr 12.

BMAL1 links the circadian clock to viral airway pathology and asthma phenotypes

Affiliations

BMAL1 links the circadian clock to viral airway pathology and asthma phenotypes

A Ehlers et al. Mucosal Immunol. 2018 Jan.

Abstract

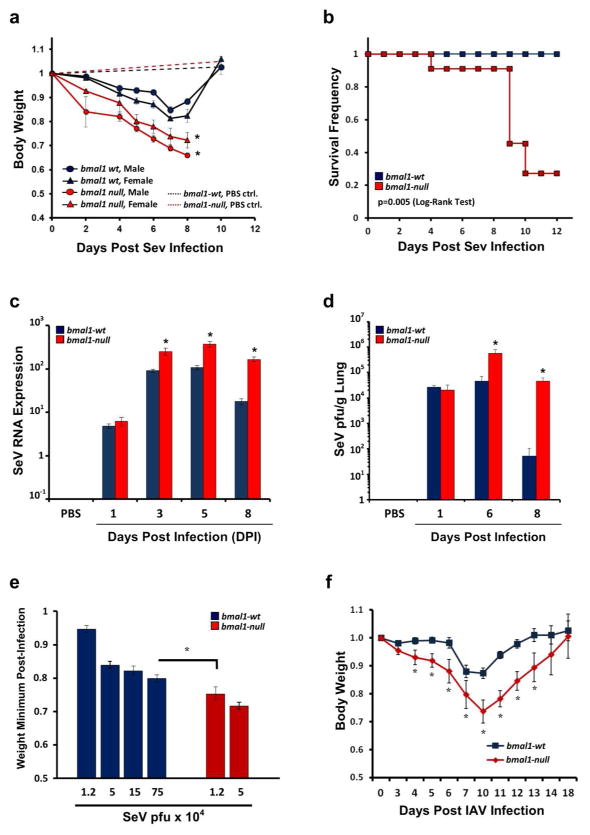
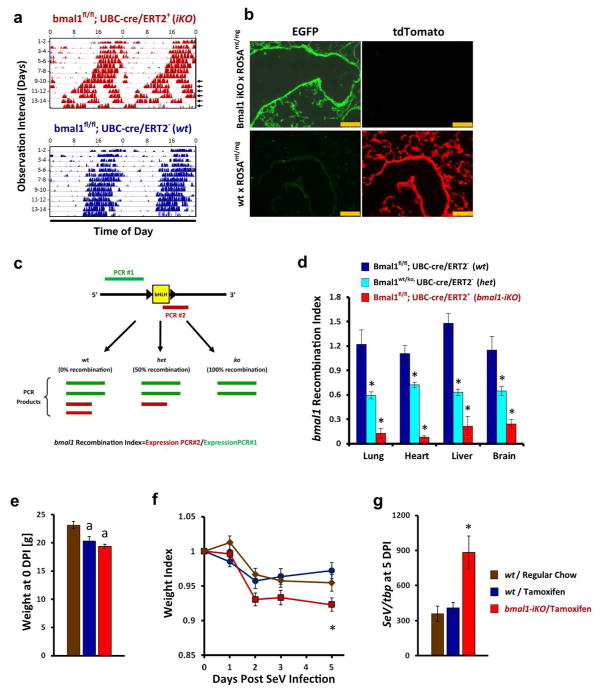
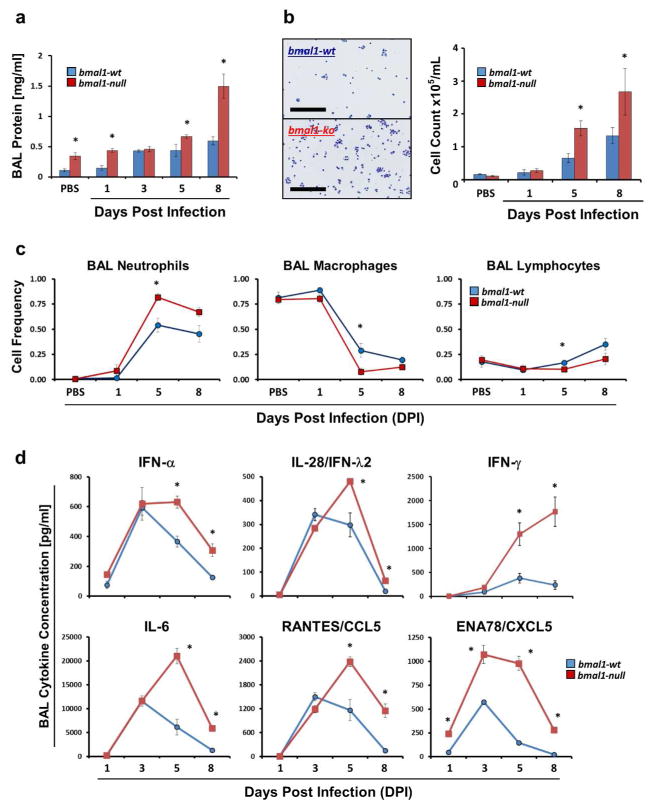
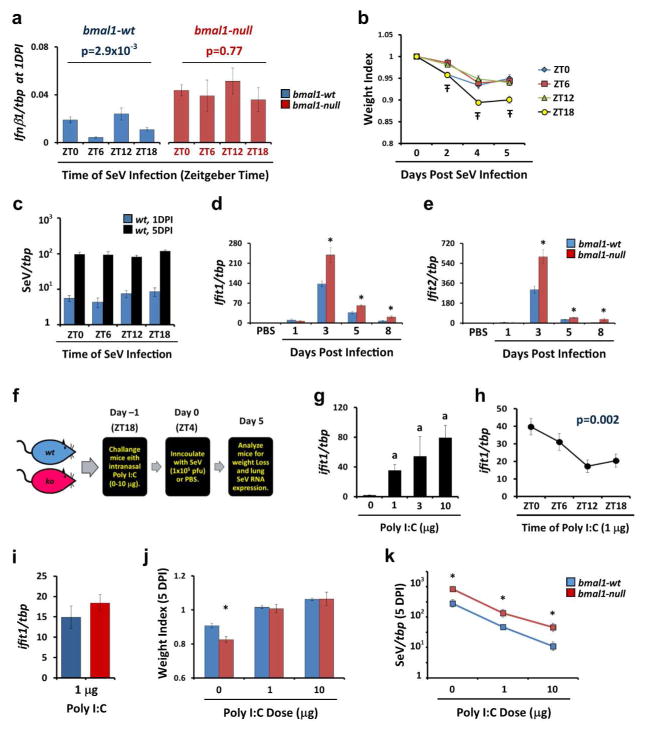
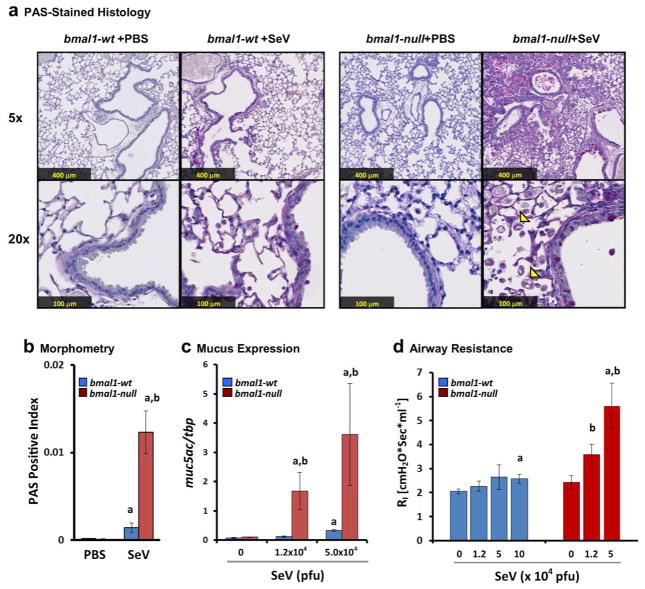
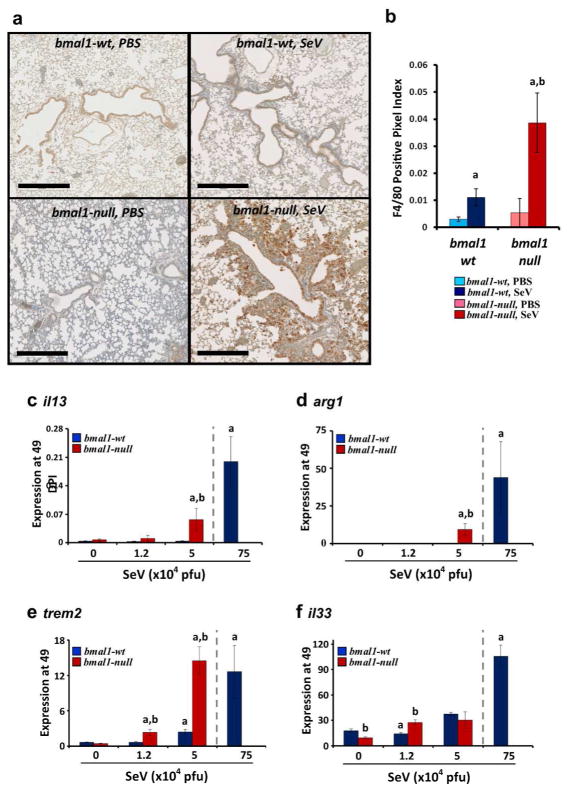
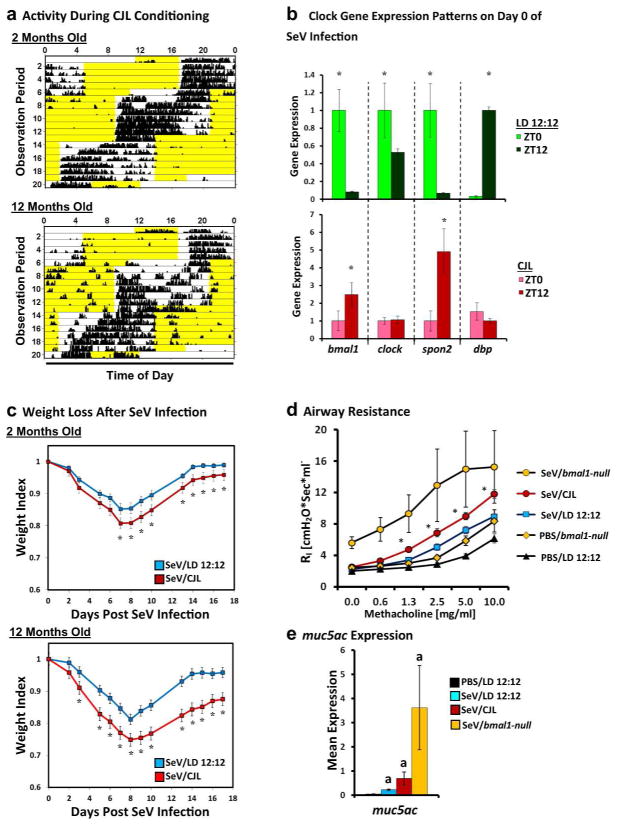
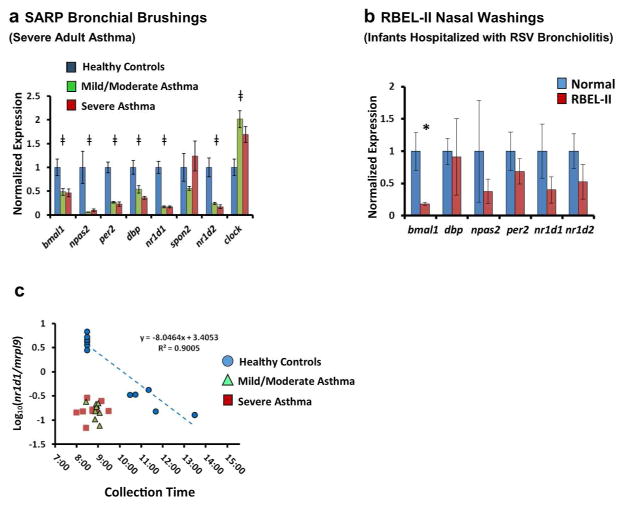
Patients with asthma experience circadian variations in their symptoms. However it remains unclear how specific aspects of this common airway disease relate to clock genes, which are critical to the generation of circadian rhythms in mammals. Here, we used a viral model of acute and chronic airway disease to examine how circadian clock disruption affects asthmatic lung phenotypes. Deletion of the core clock gene bmal1 or environmental disruption of circadian function by jet lag exacerbated acute viral bronchiolitis caused by Sendai virus (SeV) and influenza A virus in mice. Post-natal deletion of bmal1 was sufficient to trigger increased SeV susceptibility and correlated with impaired control of viral replication. Importantly, bmal1-/- mice developed much more extensive asthma-like airway changes post infection, including mucus production and increased airway resistance. In human airway samples from two asthma cohorts, we observed altered expression patterns of multiple clock genes. Our results suggest a role for bmal1 in the development of asthmatic airway disease via the regulation of lung antiviral responses to common viral triggers of asthma.


Conflict of interest statement

Conflict of Interest Statement: the authors report no conflicts of interest.

Figures

Figure 1
Figure 1
Deletion of clock gene bmal1 renders mice more vulnerable to viral bronchiolitis. (a) Animal weights (normalized to starting weight) after infection with 1.5x10⁵ pfu SeV. Each point represents the mean weight ± SE. Blue circles: SeV-infected bmal1-wt males (n=19). Blue triangles: SeV-infected bmal1-wt females (n=12). Red circles: SeV-infected bmal1−/− males (n=12). Red triangles: SeV-infected bmal1−/− females (n=12). Blue dashed line: Sham (PBS inoculated) bmal1-wt males (n=5). Red dashed line: Sham (PBS inoculated) bmal1−/− males (n=4). SeV infection data were pooled from 4 independent experiments. (b) Survival after infection with 1.5x10⁵ pfu SeV. Blue symbols: bmal1-wt (n=15). Red symbols: bmal1−/− littermates (n=11). Data is pooled from 2 independent experiments, and each group is composed of near-equal proportions of male and female animals. Note that sham (PBS) inoculation did not produce animal mortality in either genotype (data not shown). Statistical significance by Log-Rank Test is depicted. (c) Viral RNA expression as measured by qPCR at various times after intranasal infection with SeV (1.5x10⁵ pfu). Each bar represents the mean SeV gene expression normalized to tbp ± SE. Blue bars: bmal1-wt (n=4–12 per time point). Red bars: bmal1−/− littermates (n=3–11 per time point). Each group is composed of equal or near-equal proportions of male and female animals, and was pooled from 2 independent rounds of infection. (d) Lung viral load measured by plaque assay at various points after SeV infection (5.0x10⁴ pfu). Each bar represents the mean SeV plaque forming units/g of lung ± SE. Blue bars: bmal1-wt (n=5–6 per time point). Red bars: bmal1−/− littermates (n=4–6 per time point). (e) Comparison of SeV potency in bmal1−/− and wt littermate mice using weight loss as an indicator of severity. Each bar represents the weight minimum (normalized to starting weight) achieved using various doses of SeV (mean ± SE). Blue bars: bmal1-wt (n=5–21 per time point). Red bars: bmal1−/− littermates (n=8–9 per time point). Data were pooled from 4 independent experiments utilizing equal or near equal proportions of male and female mice. Note that sham (PBS) inoculated animals did not exhibit appreciable weight loss (data not shown). (f) Animal weights (normalized to starting weight) after infection with 5 pfu H1N1 IAV. Each point represents the mean weight ± SE. Blue squares: bmal1-wt (n=6). Red diamonds: bmal1−/− littermates (n=8). Equal proportions of male and female animals were used in each group. At the dose of virus tested, we did not encounter mortality in IAV infected bmal1−/− or wt animals during the acute infection. *p<0.05 bmal1−/− vs. wt littermates (Student’s 2-Tailed t-test).
Figure 2
Figure 2
Post-natal deletion of bmal1 is sufficient to exacerbate acute SeV respiratory infection. (a) Representative actigraphy depicting wheel running behavior of bmal1-iKO (bmal1fl/fl, UBC-cre/ERT2+) and non-iKO (bmal1fl/fl, UBC-cre/ERT2+) littermates, kept in constant darkness and fed tamoxifen-containing chow starting on the first day of recording. Bars represent wheel revolutions per minute and each row represents a 2 day interval of observation. Note that circadian rhythms in wheel running activity begin to break down in bmal1-iKO after 9–10 days of tamoxifen exposure (arrowheads). (b) Representative micrographs depicting cre recombination efficiency in the lungs of bmal1-iKO mice and wt mice. Bmal1-iKO and wt littermate mice were crossed with ROSAmT/mg reporter line, fed tamoxifen for 3 weeks (see Methods), and then frozen lung sections were prepared. Cre recombination efficiency is indicated by the development of EGFP (green) fluorescence and the reciprocal loss of mtTomato (red) fluorescence in cells. Scale bar=250 μm. (c) Schematic of qPCR based assay to quantify bmal1 recombination efficiency in bmal1-iKO mice. The genomic locus of bmal1 for the B6.129S4(Cg)-Arntltm1Weit/J mouse line used in this study is depicted in simplified form (black line) to illustrate the loxP sites flanking exon 8, which encodes the bHLH DNA binding domain. PCR product #1 (green) extends from exon 5–8, terminating upstream of the floxed bHLH coding sequence and therefore its production is insensitive to Cre activity. In contrast, PCR product #2 (red) initiates within the floxed bHLH coding sequence and therefore is not amplified in mRNA templates where Cre recombination has occurred. The efficiency of bmal1 recombination can therefore be expressed as the ratio of bmal1 expression detected by PCR product #2/PCR product #1. (d) Quantification of bmal1 recombination in iKO mice using qPCR. Bars represent mean bmal1 recombination index (see Methods and panel c) ±SE. Dark blue bars, bmal1-wt mice fed tamoxifen chow (no recombination, 100% bmal1gene dosage; n=6). Light-blue bars, global bmal1 heterozygous mice containing a ko/wt, genotype (i.e. 50% gene dosage; n=4). Red bars, bmal1-iKO mice fed tamoxifen chow (n=7). Note that global bmal1-null mice (where recombination occurs in utero) generate a recombination index of 0 in this assay (data not shown). *p<0.05 vs. wt littermates fed tamoxifen chow (Student’s 2-Tailed t-test). (e) Weight of bmal1-iKO and wt mice after 3 weeks of tamoxifen feeding. Bars represent mean weight ±SE. Brown bars: wt mice fed regular chow. Dark blue bars, wt mice fed tamoxifen chow. Red bars: bmal-iKO mice fed tamoxifen chow. ap<0.05 vs. wt littermates fed regular chow (Student’s 2-Tailed t-test). Data is pooled from 2 independent experiments (n=6–10 per group, equal proportions of male and female mice). (f) Animal weights (normalized to starting weight) after infection with 5x10⁴ pfu SeV. Each point represents the mean ± SE. Bar color designations and sample sizes are as described in panel e above. Data is pooled from 2 independent experiments. *p<0.05 bmal1−/− vs. wt littermates fed tamoxifen chow (Student’s 2-Tailed t-test). (g) SeV RNA expression as measured by qPCR 5 days after intranasal infection with SeV (5x10⁴ pfu). Each bar represents the mean SeV gene expression normalized to tbp ± SE. Bar color designations and sample sizes are as described in panel e above. Data is pooled from 2 independent experiments. *p<0.05 bmal1−/− vs. wt littermates fed tamoxifen chow (Student’s 2-Tailed t-test).
Figure 3
Figure 3
Airway inflammation during acute viral infection is greater in bmal1−/− mice than wt. (a) Bronchio-alveolar lavage (BAL) protein content in mg/ml (mean ± SE). Blue bars: bmal1-wt (n=4–14 per time point). Red bars: bmal1−/− (n=4–6 per time point). Equal or near-equal proportions of male and female animals were included in each group. (b) Representative images of BAL cytospins of bmal1-wt and bmal1−/− mice during acute infection and cell counts at 1, 5, and 8 days after infection with SeV (5x10⁴ pfu). Each bar represents the mean number of cells/mL of BAL fluid ± SE. Blue bars: bmal1-wt (n=4–14 per time point). Red bars: bmal1−/− littermates (n=4–6 per time point). Each group is composed of equal or near-equal proportions of male and female animals. Scale bars within the representative pictures represent 200μm. (c) Frequency of macrophages, neutrophils, and lymphocytes present in BALs of bmal1-wt (blue symbols, n=4–14 per time point) and bmal1−/− (red symbols, n=4–6 per time point) animals at various time points post SeV infection (5x10⁴ pfu). Each bar represents the mean frequency of each cell type ± SE. Groups of mice were composed of equal or near-equal proportions of male and female animals. (d) BAL cytokine concentration in bmal1-wt and bmal1−/− animals at various time points after infection with SeV (5x10⁴ pfu). Each point represents the mean cytokine concentration ± SE. Blue circles: bmal1-wt (n=4–14 per time point). Red squares: bmal1−/− (n=4–6 per time point). Each group is composed of equal or near-equal proportions of male and female animals. *p<0.05 bmal-wt vs bmal−/− (Student’s 2-Tailed t-test).
Figure 4
Figure 4
Interferon-related antiviral responses are altered in bmal1−/− mice. (a) Expression of ifnb1 measured by qPCR 24 hours after inoculation with SeV (5x10⁴ pfu). Inoculation was conducted at various times of day represented in Zeitgeber Time (ZT) where ZT0 represents “lights on” and ZT12 represents “lights off”. Each bar represents the mean ifnb1 expression normalized to tbp ± SE. Blue bars: bmal1-wt (n=9–12 per time point). Red bars: bmal1−/− (n=6–7 per time point). Depicted data was pooled from two independent time series, each showing similar time-dependence in ifnb1 expression. Statistical significance was determined by 1-way ANOVA. Note that lung infb1/tbp ratios in sham (PBS) treated mice were negligible at the ZTs tested, ranging from 2.3–4.4x10⁻⁴ in wt mice. (b) Weight loss (mean ± SE, n=10 per group) after inoculating male wt mice with SeV (5x10⁴ pfu) at various ZTs. Data was pooled from 2 independent experiments. Ŧp<0.05, 1-way ANOVA. (c) SeV RNA expression at 1DPI (blue bars) and 5DPI (black bars) after inoculating wt mice with SeV (5x10⁴ pfu) at various ZTs. Data was pooled from 2 independent experiments (n=9–12 per group). (d, e) Gene expression of ifit1 (d), and ifit2 (e) normalized to tbp. Each bar represents the mean expression ± SE at various time points after infection with SeV (5x10⁴ pfu). Blue bars: bmal1-wt (n=4–14 per time point). Red bars: bmal1−/− littermates (n=4–6 per time point). Each group is composed of equal or near-equal proportions of male and female animals pooled from 2 independent rounds of SeV infection. *p<0.05 bmal1-wt vs bmal−/−(Student’s 2-Tailed t-test). (f) Cartoon depicting our protocol for pre-activating interferon responses in mice prior to SeV challenge using the TLR3 agonist Poly (I:C) (also see Methods). Mice received an intranasal challenge of Poly (I:C) and the following morning were inoculated with SeV. The mice were then harvested at 5DPI to assess SeV viral load. (g) Dose response relationship between intranasal Poly (I:C) and stimulation of interferon responses as reflected by induction of ifit1 expression. wt male mice were challenged with the indicated amount of Poly (I:C) and lungs were obtained for qPCR analysis on Day 0 as depicted in panel (f). Bars represent mean ifit1/tbp ratios ± SE (n=3 per group). ap<0.05 vs. PBS treated wt mice (Student’s 2-Tailed t-test). (h) Induction of lung ifit1 expression in wt male mice by 1 μg intranasal Poly (I:C) administered at different ZTs. Data points represent mean ifit1/tbp ratios ± SE (n=9 per data point, pooled from 3 independent experiments). For each data point, lungs were collected 12 hours after Poly (I:C) inoculation. (i) Induction of ifit1 expression by 1 μg Poly (I:C) in bmal1−/− (red bars) and wt (blue bars) littermates. Bars represent mean ifit1/tbp ratios ± SE (n=5–6 per group, pooled from 2 independent experiments). Male and female mice were used in equal or near equal proportion in these experiments. (j) Effect of Poly (I:C) pre-treatment on weight loss after SeV infection (1x10⁵ pfu) in bmal1−/− (red bars) and wt (blue bars) littermates. Bars represent mean weight ± SE at 5 DPI, expressed as a fraction of the starting weight (n=6–30 per group). Data depicted was pooled from 2–4 independent experiments per dose of Poly (I:C) and employed male and female mice in equal or near equal proportion. *p<0.05 bmal1-wt vs bmal−/− (Student’s 2-Tailed t-test). (k) Effect of Poly (I:C) pre-treatment on SeV RNA expression in bmal1−/− (red bars) and wt (blue bars) littermates, 5 days after infection (1x10⁵ pfu). Data points represent mean SeV/tbp ratios ± SE at 5 DPI (n=9–35 per group). Data depicted was pooled from 3–4 independent experiments per dose of Poly (I:C), each showing similar results, and employed male and female mice in equal or near equal proportion. *p<0.05 bmal1-wt vs bmal1−/− (Student’s 2-Tailed t-test).
Figure 5
Figure 5
Deletion of bmal1 exacerbates chronic lung disease after SeV Infection. (a) Representative micrographs of PAS stained lung sections at day 49 after sham (PBS) or SeV (5 x 10⁴ pfu). For each panel the upper picture is at 5x magnification and the lower is at 20x. Note the increased distortion of lung architecture in SeV challenged bmal1−/− mice compared to wt and the infiltration of crystal-laden macrophages (arrowheads). (b) Quantification of PAS+ staining in SeV-infected or sham (PBS treated) bmal1−/− and wt littermate lung sections at 49 DPI (red and blue bars respectively). Bars represent the mean ratio of PAS+ (magenta) pixels to total pixels ± SE. (c) Expression of muc5ac at day 49 as a function of SeV inoculum. Each bar represents the mean expression ± SE normalized to the housekeeping gene tbp. Blue bars: bmal1-wt (n=5–9 per group). Red bars: bmal1−/− littermates (n=3–6 per group). (d) Airway resistance at day 49 as a function of SeV inoculum. Each bar represents the mean airway resistance ± SE. Blue bars: bmal1-wt (n=5–9 per group). Red bars: bmal1−/− littermates (n=3–6 per group). ap<0.05 SeV-infected vs. PBS-control (Student’s 2-Tailed t-Test), bp<0.05 SeV-infected bmal1−/− vs. wt (Student’s 2-Tailed t-test).
Figure 6
Figure 6
Expression of M2 signatures is enhanced in bmal1−/− mice post-SeV infection. (a) Representative images of lungs at 49 DPI stained with macrophage marker F4/80. Scale bar=500 μm. (b) Quantification of F4/80+ staining in immunohistochemical sections expressed as a fraction of positive stained pixels (mean expression ± SE, n=3–4 per group). ap<0.05 versus sham (PBS) infected wt controls, bp<0.05 bmal1−/− vs. wt (Student’s 2-Tailed t-test). (c–f). Mice were infected with the indicated dose of SeV, and at 49DPI lungs were harvested and analyzed for gene expression using tbp as a housekeeping gene. As a positive control, lung gene expression in wt mice exposed to a high dose of SeV (75x104 pfu) is depicted to the right in each panel and separated by a dashed line. Each bar represents the mean expression ± SE. (c) il13 expression. (d) arg1 expression. (e) trem2 expression. (f) il33 expression. Red bars indicate bmal1−/− mice (n=3–4 per group), and blue bars denote wt littermates (n=5–9 per group). ap<0.05 versus sham (PBS) infected wt controls, bp<0.05 bmal1−/− vs. wt (Student’s 2-Tailed t-test). Equal or near equal numbers of male and female mice were utilized per group.
Figure 7
Figure 7
Effect of chronic jet lag (CJL) on acute and chronic SeV lung pathology. (a) Representative actigraphs depicting wheel running activity during CJL conditioning, which consisted of weekly 8-hour phase advances in juvenile (2 months old, upper panel) and middle aged (12 months old, lower panel) mice. Black vertical bars represent wheel revolutions per epoch, and each row represents one day of recording. Yellow highlighted regions represent lights-on. (b) Expression of various clock genes at subjective dawn (ZT0) and dusk (ZT12) for mice living under standard 12 hour day-night lighting (LD 12:12, green bars) or CJL (red bars) after the final phase advance in our protocol. Each bar represents the mean expression ± SE (n=3 per group). For each clock gene, expression is normalized to the housekeeping gene tbp and then further standardized to mean expression at ZT0 for ease of viewing. The data depicted was obtained from middle aged mice, but similar changes were observed in juvenile mice subjected to CJL. *p<0.05 ZT0 vs. ZT12 (Student’s 2-Tailed t-test). (c) Weight loss in standard-housed (blue line, n=7–15 per group) and CJL conditioned (red line, n=12–15 per group) mice after infection with SeV (1.5x10⁵ pfu). Data represents the mean weight index ± SE and is representative of two independent experiments. Note that we did not encounter significant mortality in either CJL or control mice during acute SeV infection for these experiments. *p<0.05 CJL vs. LD12:12 (Student’s 2-Tailed t-test). Male mice were used for these experiments. (d) Airway resistance in SeV-infected mice at 49 DPI (1.5x10⁵ pfu) that were conditioned with CJL or standard lighting (LD 12:12). Each line represents the mean airway resistance measured after doubling doses of methacholine ± SE. Orange circles: SeV-infected bmal1-null mice (n=3). Red circles: SeV-infected, CJL conditioned mice (n=11). Blue Squares: SeV-infected mice under normal lighting conditions (n=9). Black triangles: PBS-treated mice under normal lighting conditions (n=5). Orange diamonds: PBS-treated bmal1-null mice (n=6). *p<0.05 SeV/CJL vs. SeV/LD 12:12 (Student’s 2-Tailed t-test). (e) Lung expression of muc5ac at 49 DPI with SeV. Each bar represents the mean muc5ac expression normalized to tbp ± SE. Black bar: PBS-treated mice under normal lighting conditions (n=5). Blue bar: SeV-infected mice under normal lighting conditions (n=9). Red bar: SeV-infected mice subjected to CJL protocol before infection (n=11). Yellow bar: SeV-infected, bmal1-null mice under normal lighting conditions (n=3). Note that in panels (d) and (e), the bmal1−/− mice depicted were inoculated with 5x10⁴ pfu, as this was the highest dose that was below the LD50 in this genotype. ap<0.05 vs PBS/LD 12:12 (Student’s 2-Tailed t-test).
Figure 8
Figure 8
Differential expression of clock genes in airway samples from two asthma cohorts. (a) Expression of circadian clock genes in bronchial brush samples obtained from adult patients with severe asthma (n=9, red bars), mild/moderate asthma (n=9, green bars), and healthy volunteers (n=6, blue bars) who participated in SARP. All samples were collected between 0800 and 0930 hours. Bars represent mean expression ratios±s.e. normalized to mrpl9. To simplify the visual depiction of data, expression was then further normalized to the mean for non-asthmatic control subjects. ‡P<0.05 (one-way ANOVA). (b) Clock gene expression in nasal wash samples previously obtained from young children hospitalized for RSV bronchiolitis (n=10, red bars) and control subjects (n=5, blue bars) who participated in RBEL-II. All samples were collected between 1015 1220 hours. Bars represent mean expression ratios±s.e. normalized to mrpl9. To simplify the visual depiction of data, expression was then further normalized to the mean for non-asthmatic control subjects. (c) Log10 normalized nr1d1/mrpl9 expression ratios from SARP participants (Mean±s.e.), graphed as a function of collection time. Blue circles: healthy volunteers (n=11). Green triangles: mild/moderate asthma (n=9). Red squares (severe asthma, n=9). A regression line is depicted for the healthy control samples (blue dashed line). Extrapolating from this line, the time difference that would be needed to reproduce the nr1d1 expression seen in asthmatic subjects using healthy controls is 3.61±0.14 h for mild/moderate asthmatics, and 3.91±0.26 h for severe asthmatics. *P<0.05 (Student’s two-tailed t-test). ANOVA, analysis of variance; RSV, respiratory syncytial virus; SARP, Severe Asthma Research Program.

References

    1. Bergeron C, Al-Ramli W, Hamid Q. Remodeling in asthma. Proceedings of the American Thoracic Society. 2009;6(3):301–305. - PubMed
    1. Meissner HC. Viral Bronchiolitis in Children. The New England journal of medicine. 2016;374(18):1793–1794. - PubMed
    1. Corne JM, Marshall C, Smith S, Schreiber J, Sanderson G, Holgate ST, et al. Frequency, severity, and duration of rhinovirus infections in asthmatic and non-asthmatic individuals: a longitudinal cohort study. Lancet. 2002;359(9309):831–834. - PubMed
    1. Bonnelykke K, Vissing NH, Sevelsted A, Johnston SL, Bisgaard H. Association between respiratory infections in early life and later asthma is independent of virus type. The Journal of allergy and clinical immunology. 2015;136(1):81–86. e84. - PMC - PubMed
    1. Wark PA, Johnston SL, Bucchieri F, Powell R, Puddicombe S, Laza-Stanca V, et al. Asthmatic bronchial epithelial cells have a deficient innate immune response to infection with rhinovirus. The Journal of experimental medicine. 2005;201(6):937–947. - PMC - PubMed

Publication types

MeSH terms

Substances