. 2018 Jan;11(1):120-130.
doi: 10.1038/mi.2017.31. Epub 2017 Apr 12.

MDR1 deficiency impairs mitochondrial homeostasis and promotes intestinal inflammation

Affiliations

MDR1 deficiency impairs mitochondrial homeostasis and promotes intestinal inflammation

G-T Ho et al. Mucosal Immunol. 2018 Jan.

Abstract

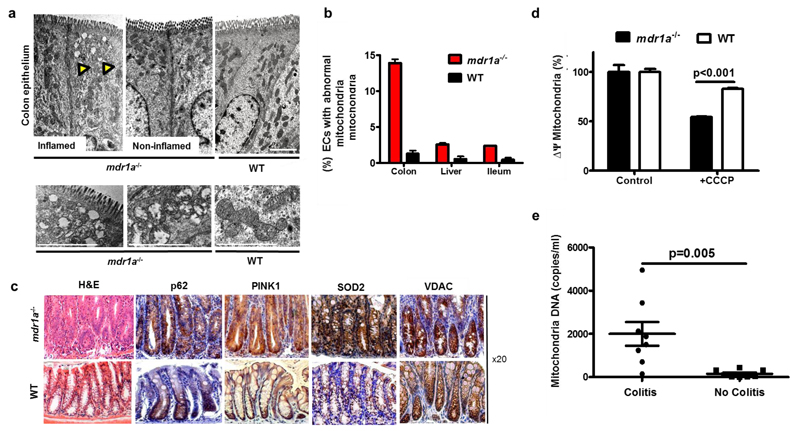
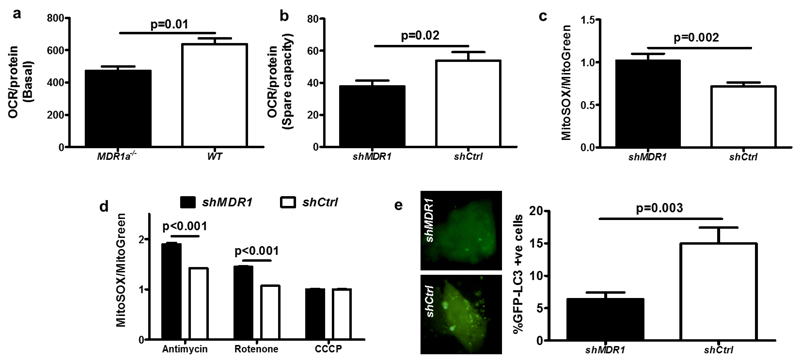
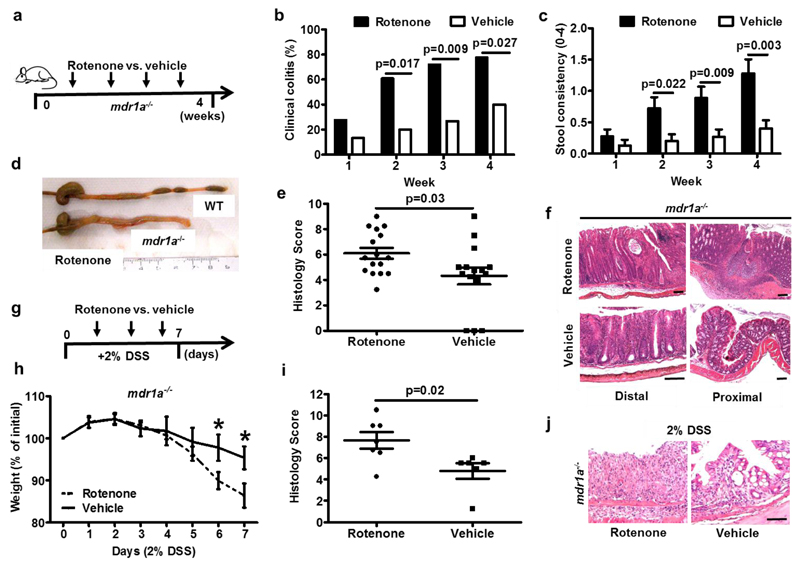
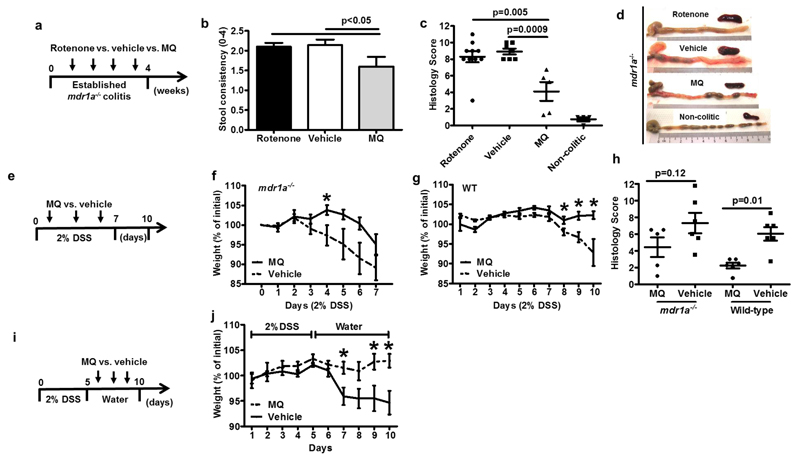
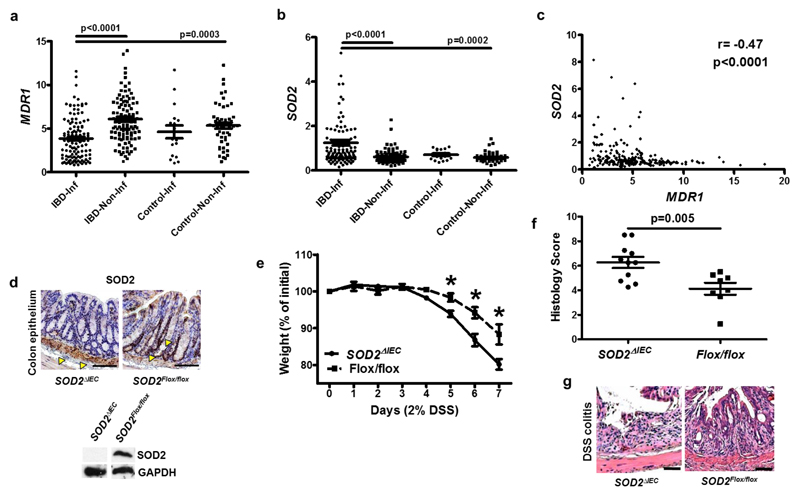
The multidrug resistance-1 (MDR1) gene encodes an ATP-dependent efflux transporter that is highly expressed in the colon. In mice, loss of MDR1 function results in colitis with similarities to human inflammatory bowel diseases (IBD). Here, we show that MDR1 has an unexpected protective role for the mitochondria where MDR1 deficiency results in mitochondrial dysfunction with increased mitochondrial reactive oxygen species (mROS) driving the development of colitis. Exogenous induction of mROS accelerates, while inhibition attenuates colitis in vivo; these effects are amplified in MDR1 deficiency. In human IBD, MDR1 is negatively correlated to SOD2 gene expression required for mROS detoxification. To provide direct evidential support, we deleted intestinal SOD2 gene in mice and showed an increased susceptibility to colitis. We exploited the genome-wide association data sets and found many (∼5%) of IBD susceptibility genes with direct roles in regulating mitochondria homeostasis. As MDR1 primarily protects against xenotoxins via its efflux function, our findings implicate a distinct mitochondrial toxin+genetic susceptibility interaction leading to mitochondrial dysfunction, a novel pathogenic mechanism that could offer many new therapeutic opportunities for IBD.


Figures

Figure 1
Figure 1. Damaged mitochondria accumulate within mdr1a-deficient colonic epithelium:
(a) Representative TEM (n=6 per group) of colonic epithelium. Scale bar 2µm. Yellow arrows denoting damaged mitochondria. (b) Quantitative analyses of CEC containing damaged mitochondria (n=6/group). (c) Representative H&E and immunohistochemistry of colon (p62, PINK-1, SOD2 and VDAC) (n=6/group). (d) Loss of mitochondria membrane potential, JC-1 fluorescence in isolated mitochondria (n=6/group) (e) Plasma qPCR of mitochondrial DNA mdr1a-/- mice with colitis vs. no colitis (n=8/group). WT – wild-type. All data represent mean± SEM.
Figure 2
Figure 2. MDR1 deficiency results in mitochondria dysfunction:
(a) Oxygen consumption rate, OCR (pmol/minute) in primary colonic explant in mdr1a-deficient vs. WT respectively (n=4). (b) Spare respiratory capacity (SRC) of T84 shMDRI and shCtrl (5 replicates). (c) Normalised MitoSOX/Mitotracker Green fluorescence T84 shMDR1 vs. shCtrl, (n=11/group, representative of 3 independent experiments. (d) Relative MitoSOX/Mitotracker Green fluorescence to respective untreated group in T84 shMDR1 vs. shCtrl (n=8/treatment group, representative of 3 independent experiments). (e) Quantification of GFP-LC3 shMDR1 vs. shCtrl (n=12 slides/group). %GFP-LC3+ve cells/number of cells in 10 fields (X40 microscopy). All data represent mean± SEM.
Figure 3
Figure 3. Experimental induction of mROS accelerates spontaneous colitis in mdr1a-deficiency and in acute DSS-colitis:
(a) Experimental protocol of 4-week colonic administration of rotenone vs. vehicle (3x/week). (b) Prevalence of clinical colitis in rotenone vs. vehicle treated mdr1a-/- at weekly intervals (n=18 and 15 mice treated with rotenone and vehicle respectively). (c) Stool consistency measurements in rotenone vs. vehicle treated mdr1a-/- at weekly intervals. (d) Representative images of mdr1a-/- and WT whole colons treated with colonic rotenone. (e) Histology scores of rotenone vs. vehicle treated mdr1a-/- colons. (f) Representative H&E distal and proximal colons; and histology scores of rotenone vs. vehicle treated mdr1a-/-, black scale bars 100 µm. (g) Experimental protocol of colonic rotenone vs. vehicle – 3 times during 7-day 2% DSS in drinking water. (h) Daily percentage of change from initial weight in rotenone vs. vehicle treated mdr1a-/- acute DSS colitis (n=7/group). (i, j) Representative histology scores and H&E colons of rotenone vs. vehicle treated mdr1a-/- (n=7/group) in acute DSS colitis, black scale bar 50µm. All data represent mean± SEM.
Figure 4
Figure 4. Inhibition of mitochondria ROS effects attenuates and promotes recovery from colitis:
(a) Experimental protocol of 4-week colonic administration of rotenone vs. vehicle vs. MQ (3x/week) in mdr1a-/- with established chronic colitis. (b) Stool consistency measurements in rotenone vs. vehicle treated vs. MQ in mdr1a-/- at weekly intervals. (c) Histology colitis scores of rotenone vs. vehicle vs. MQ vs. non-colitic mdr1a-/- mice. (d) Representative whole colons and spleen sizes of and H&E of rotenone vs. vehicle vs. MQ vs. non-colitic mdr1a-/- mice. (e) Experimental protocol of colonic MQ vs. vehicle – 3x administrations during 7-day 2% DSS colitis protocol. (f, g) Daily percentages change from initial weight clinical colitis in MQ vs. vehicle in mdr1a-/- (n=6/group) and and WT mice (n=6/group) respectively. (h) Histology colitis scores in MQ vs. vehicle treated mdr1a-/- and WT mice, scale bar 50µm. (i) Experimental protocol of colonic MQ vs. vehicle treatment after 5 days of 2% DSS colitis protocol in WT mice. (j) Daily percentages of change from initial weight in MQ vs. vehicle treated WT, (n=8/7 respectively). All data represent mean± SEM.
Figure 5
Figure 5. MDR1 and SOD2 genes are differentially expressed in human IBD and intestinal epithelial specific deletion of SOD2 leads to increased susceptibility to experimental colitis:
(a-b) In silico analysis of MDR1 and SOD2 from 120 IBD patients (67 UC, 53 CD, 17 non-IBD colitis and 31 healthy controls); IBD-Inf = Inflamed IBD gut biopsies, IBD-Non-Inf = Non-inflamed IBD gut biopsies; Control-Inf = Non-IBD colitis and Control-Non-Infl =Non-inflamed gut biopsies from non-IBD individuals. (c) Spearman’s correlation test of MDR1 and SOD2 expression in 120 IBD patients. (d) Representative immunohistochemistry and Western blotting of SOD2 of colons (a) of SOD2IEC-KO and SOD2flox/flox of CECs, black scale bars 100 µm, yellow arrows showing SOD2 staining. (e) Daily percentages of weight change from initial weight in acute 2% DSS colitis comparing SOD2IEC-KO vs. SOD2flox/flox (n=12/8 respectively). (f) Histology colitis scores in SOD2IEC-KO vs. SOD2flox/flox mice (n=12/8 respectively). after 2% DSS colitis. (g) Representative H&E staining in SOD2IEC-KO vs. SOD2flox/flox mice after 2% DSS colitis, black scale bars 100 µm. All data represent mean± SEM.

References

    1. Danese S, Fiocchi C. Ulcerative colitis. The New England journal of medicine. 2011;365:1713–1725. - PubMed
    1. Boyapati R, Satsangi J, Ho GT. Pathogenesis of Crohn's disease. F1000prime reports. 2015;7:44. - PMC - PubMed
    1. Molodecky NA, et al. Increasing incidence and prevalence of the inflammatory bowel diseases with time, based on systematic review. Gastroenterology. 2012;142:46–54.e42. quiz e30. - PubMed
    1. Ho G-T, Boyapati R, Satsangi J. Ulcerative colitis. Medicine. 2015;43:276–281.
    1. Jostins L, et al. Host-microbe interactions have shaped the genetic architecture of inflammatory bowel disease. Nature. 2012;491:119–124. - PMC - PubMed

Substances