. 2017 May 24;9(5):556-563.
doi: 10.1039/c7mt00035a.

Tight binding of heme to Staphylococcus aureus IsdG and IsdI precludes design of a competitive inhibitor

Affiliations

Tight binding of heme to Staphylococcus aureus IsdG and IsdI precludes design of a competitive inhibitor

Matthew A Conger et al. Metallomics. .

Abstract

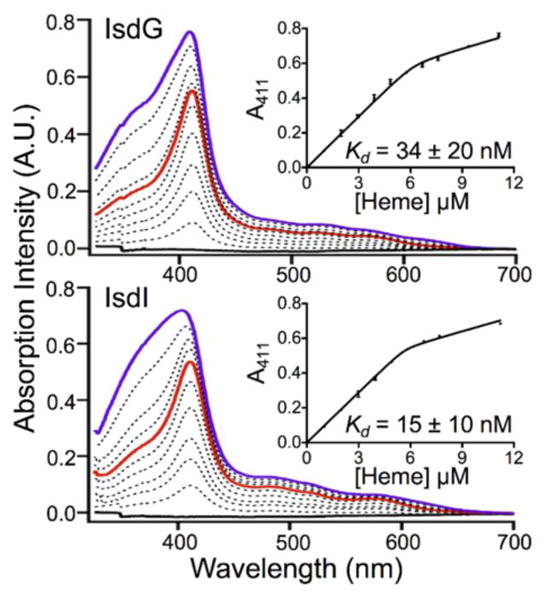
The micromolar equilibrium constants for heme dissociation from IsdG and IsdI reported in the literature call into question whether these enzymes are actually members of the iron-regulated surface determinant system of Staphylococcus aureus, which harvests heme iron from a host during infection. In order to address this question, the heme dissociation constants for IsdG and IsdI were reevaluated using three approaches. The heme dissociation equilibrium constants were measured using a UV/Vis absorption-detected assay analyzed with an assumption-free model, and using a newly developed fluorescence-detected assay. The heme dissociation rate constants were estimated using apomyoglobin competition assays. Analyses of the UV/Vis absorption data revealed a critical flaw in the previous measurements; heme is 99.9% protein-bound at the micromolar concentrations needed for UV/Vis absorption spectroscopy, which renders accurate equilibrium constant measurement nearly impossible. However, fluorescence can be measured for more dilute samples, and analyses of these data resulted in dissociation equilibrium constants of 1.4 ± 0.6 nM and 12.9 ± 1.3 nM for IsdG and IsdI, respectively. Analyses of the kinetic data obtained from apomyoglobin competition assays estimated heme dissociation rate constants of 0.022 ± 0.002 s-1 for IsdG and 0.092 ± 0.008 s-1 for IsdI. Based upon these data, and what is known regarding the post-translational regulation of IsdG and IsdI, it is proposed that only IsdG is a member of the heme iron acquisition pathway and IsdI regulates heme homeostasis. Furthermore, the nanomolar dissociation constants mean that heme is bound tightly by IsdG and indicates that competitive inhibition of this protein will be difficult. Instead, uncompetitive inhibition based upon a detailed understanding of enzyme mechanism is a more promising antibiotic development strategy.


Figures

Fig. 1
Fig. 1
There are several important differences between human HOs and the non-canonical HOs IsdG and IsdI from S. aureus. Human HOs bind heme via His25 with nanomolar Kd values and degrade this substrate to biliverdin, carbon monoxide, and iron. Asp140 organizes a network of water molecules that guides a transient hydroxyl radical to the meso carbon of heme. In contrast, S. aureus IsdG and IsdI have been reported to bind heme via His76/77 with micromolar Kd values and produce statphylobilin, formaldehyde, and iron. The second-sphere residues Asn6/7 and Trp66/67 are essential for enzymatic turnover.
Fig. 2
Fig. 2
IsdG and IsdI degrade heme to staphylobilin via a meso-hydroxyheme intermediate. The first oxygenation reaction proceeds via a mechanism that is distinct from that of human HOs. The second oxygenation reaction is unique to IsdG and IsdI.
Fig. 3
Fig. 3
UV/Vis absorption-detected titration of heme into 6 μM IsdG (top) and IsdI (bottom) in 50 mM Tris pH 7.4, 150 mM NaCl. The spectra depict protein in the presence of 0 (solid black), 1 (solid red), 2 (solid violet), and intermediate (dashed black) equivalents of heme. Fits of the UV/Vis absorption intensity at 411 nm to equation 1 are shown in the insets, yielding Kd values of 34 ± 20 nM for IsdG and 15 ± 10 nM for IsdI. The vertical error bars represent the standard deviation of at least three independent measurements.
Fig. 4
Fig. 4
Best fits of the UV/Vis absorption-detected heme titration data for IsdG (top) and IsdI (bottom) using equation 1 (solid black). The vertical error bars represent the standard deviation of at least three independent measurements. Titration curves predicted using equation 1 for Kd values one order of magnitude smaller (dotted red) and larger (dashed blue) than the best fit. Based upon the good fit of the UV/Vis absoprtion-detected heme titration data to a Kd value one order of magnitude smaller than the best fit, the Kd values estimated by UV/Vis absorption appear to be upper bounds on the actual value.
Fig. 5
Fig. 5
Fluorescence-detected titration of heme into 80 nM IsdG (top) and 60 nM IsdI (bottom) in 50 mM Tris pH 7.4, 150 mM NaCl. The vertical error bars represent the standard deviation of at least three independent measurements. The emission spectra for 285 nm excitation are shown in the insets. Fits of the emission intensity to equation 2 yielded Kd values of 1.4 ± 0.6 nM for IsdG and 12.9 ± 1.3 nM for IsdI.
Fig. 6
Fig. 6
Best fits of the fluorescence-detected heme titration data for IsdG (top) and IsdI (bottom) using equation 2 (solid black). The vertical error bars represent the standard deviation of at least three independent measurements. Titration curves predicted using equation 2 for Kd values one order of magnitude smaller (dotted red) and larger (dashed blue) than the best fit. Based upon the poor fit of the fluorescence-detected heme titration data to Kd values one order of magnitude smaller or larger than the best fit, the Kd values determined by fluorescence spectroscopy are accurate.
Fig. 7
Fig. 7
UV/Vis absorption-detected kinetic traces for heme transfer from 3 μM IsdG–heme to 30 μM apomyoglobin (top) and 3 μM IsdI–heme to 30 μM apomyoglobin (bottom) in 50 mM Tris pH 7.4, 150 mM NaCl. The first 100 s of data are shown in the insets. The gray shaded regions represent the standard deviation of at least three separate measurements. Fits of the kinetic data to equation 3 yielded koff values of 0.022 ± 0.002 and 0.092 ± 0.008 s-1 for IsdG–heme and IsdI–heme, respectively.
Fig. 8
Fig. 8
At least three strategies for IsdG inhibition can be envisaged. Based upon the Kd value reported here, competitive inhibition of IsdG seems impractical. However, uncompetitive or allosteric inhibition of IsdG should be feasible. Due to the significant structural and functional differences between IsdG and mammalian heme oxygenases, elucidation of the IsdG mechanism followed by design of an uncompetitve inhibitor appears to be the most promising strategy for development of a new antibiotic.

Similar articles

Cited by

References

    1. David MZ, Daum RS. Clin Microbiol Rev. 2010;23:616–687. - PMC - PubMed
    1. Mazmanian SK, Skaar EP, Gaspar AH, Humayun M, Gornicki P, Jelenska J, Joachmiak A, Missiakas DM, Schneewind O. Science. 2003;299:906–909. - PubMed
    1. Reniere ML, Skaar EP. Mol Microbiol. 2008;69:1304–1315. - PMC - PubMed
    1. Muryoi N, Tiedemann MT, Pluym M, Cheung J, Heinrichs DE, Stillman MJ. J Biol Chem. 2008;283:28125–28136. - PMC - PubMed
    1. Skaar EP, Gaspar AH, Schneewind O. J Biol Chem. 2004;279:436–443. - PubMed

Publication types

MeSH terms

LinkOut - more resources