Analysis of aneuploid lines of bread wheat to map chromosomal locations of genes controlling root hair length
- PMID: 28402495
- PMCID: PMC5604551
- DOI: 10.1093/aob/mcx030
Analysis of aneuploid lines of bread wheat to map chromosomal locations of genes controlling root hair length
Abstract
Background and aims: Long root hairs enable the efficient uptake of poorly mobile nutrients such as phosphorus. Mapping the chromosomal locations of genes that control root hair length can help exploit the natural variation within crops to develop improved cultivars. Genetic stocks of the wheat cultivar 'Chinese Spring' were used to map genes that control root hair length.
Methods: Aneuploid stocks of 'Chinese Spring' were screened using a rapid method based on rhizosheath size and then selected lines were assayed for root hair length to identify chromosomes harbouring genes controlling root hair length. A series of lines with various fractional deletions of candidate chromosomes were then screened to map the root hair loci more accurately. A line with a deletion in chromosome 5A was analysed with a 90 000 single nucleotide polymorphism (SNP) array. The phosphorus acquisition efficiency (PAE) of one deletion line was compared with that of euploid 'Chinese Spring' by growing the seedlings in pots at low and luxury phosphorus supplies.
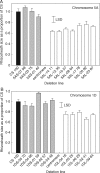
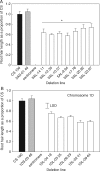
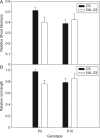
Key results: Chromosomes 1A, 1D and 5A were found to harbour genes controlling root hair length. The 90 000 SNP array identified two candidate genes controlling root hair length located on chromosome 5A. The line with a deletion in chromosome 5A had root hairs that were approx. 20 % shorter than euploid 'Chinese Spring', but this was insufficient to reduce its PAE.
Conclusions: A rapid screen for rhizosheath size enabled chromosomal regions controlling root hair length to be mapped in the wheat cultivar 'Chinese Spring' and subsequent analysis with an SNP array identified candidate genes controlling root hair length. The difference in root hair length between euploid 'Chinese Spring' and a deletion line identified in the rapid screen was still apparent, albeit attenuated, when the seedlings were grown on a fully fertilized soil.
Keywords: Chinese Spring; Root hairs; Triticum aestivum; aneuploidy; phosphorus acquisition efficiency; rhizosheath.
© The Author 2017. Published by Oxford University Press on behalf of the Annals of Botany Company. All rights reserved. For Permissions, please email: journals.permissions@oup.com
Figures


Similar articles
-
Characterization of the multigene family TaHKT 2;1 in bread wheat and the role of gene members in plant Na(+) and K(+) status.BMC Plant Biol. 2014 Jun 11;14:159. doi: 10.1186/1471-2229-14-159. BMC Plant Biol. 2014. PMID: 24920193 Free PMC article.
-
The genetics of rhizosheath size in a multiparent mapping population of wheat.J Exp Bot. 2015 Aug;66(15):4527-36. doi: 10.1093/jxb/erv223. Epub 2015 May 11. J Exp Bot. 2015. PMID: 25969556 Free PMC article.
-
Rhizosheaths on wheat grown in acid soils: phosphorus acquisition efficiency and genetic control.J Exp Bot. 2016 Jun;67(12):3709-18. doi: 10.1093/jxb/erw035. Epub 2016 Feb 11. J Exp Bot. 2016. PMID: 26873980 Free PMC article.
-
Development of a deletion and genetic linkage map for the 5A and 5B chromosomes of wheat (Triticum aestivum).Genome. 2012 Jun;55(6):417-27. doi: 10.1139/g2012-028. Epub 2012 May 25. Genome. 2012. PMID: 22624876
-
Quick mapping and characterization of a co-located kernel length and thousand-kernel weight-related QTL in wheat.Theor Appl Genet. 2022 Aug;135(8):2849-2860. doi: 10.1007/s00122-022-04154-4. Epub 2022 Jul 8. Theor Appl Genet. 2022. PMID: 35804167 Review.
Cited by
-
Comparative transcriptomic and metabolic analysis of wild and domesticated wheat genotypes reveals differences in chemical and physical defense responses against aphids.BMC Plant Biol. 2020 Jan 13;20(1):19. doi: 10.1186/s12870-019-2214-z. BMC Plant Biol. 2020. PMID: 31931716 Free PMC article.
-
Transgressive expression and dosage effect of A09 chromosome genes and their homoeologous genes influence the flowering time of resynthesized allopolyploid Brassica napus.BMC Plant Biol. 2025 Feb 19;25(1):226. doi: 10.1186/s12870-025-06236-z. BMC Plant Biol. 2025. PMID: 39972272 Free PMC article.
-
Mapping of Aegilops speltoides derived leaf rust and stripe rust resistance genes using 35K SNP array.BMC Genom Data. 2024 Jul 15;25(1):69. doi: 10.1186/s12863-024-01247-5. BMC Genom Data. 2024. PMID: 39009972 Free PMC article.
-
Loci and candidate genes controlling root traits in wheat seedlings-a wheat root GWAS.Funct Integr Genomics. 2019 Jan;19(1):91-107. doi: 10.1007/s10142-018-0630-z. Epub 2018 Aug 27. Funct Integr Genomics. 2019. PMID: 30151724
References
-
- Barabaschi D, Magni F, Volante A, et al.2015. Physical mapping of bread wheat chromosome 5A: an integrated approach. Plant Genome 8. doi: 10.3835/plantgenome2015.03.0011 - PubMed
-
- Bates TR, Lynch JP.. 1996. Stimulation of root hair elongation in Arabidopsis thaliana by low phosphorus availability. Plant, Cell & Environment 19: 529–538.
-
- Bates TR, Lynch JP.. 2000. Plant growth and phosphorus accumulation of wild type and two root hair mutants of Arabidopsis thaliana (Brassicaceae). American Journal of Botany 87: 958–963. - PubMed
-
- Debuyser J, Hachemirachedi S, Lemee ML, Sejourne S, Marcotte JL, Henry Y.. 1992. Aneuploid analysis of anther culture response in wheat. Plant Breeding 109: 339–342.
MeSH terms
LinkOut - more resources
Full Text Sources
Other Literature Sources

