. 2017 Apr 11;19(2):321-334.
doi: 10.1016/j.celrep.2017.03.056.

STIM1 Ca2+ Sensor Control of L-type Ca2+-Channel-Dependent Dendritic Spine Structural Plasticity and Nuclear Signaling

Affiliations

STIM1 Ca2+ Sensor Control of L-type Ca2+-Channel-Dependent Dendritic Spine Structural Plasticity and Nuclear Signaling

Philip J Dittmer et al. Cell Rep. .

Abstract

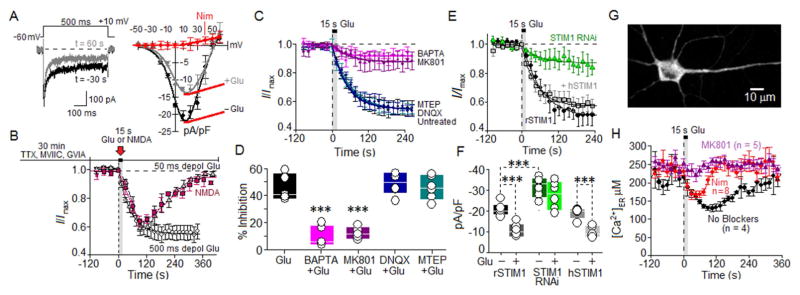
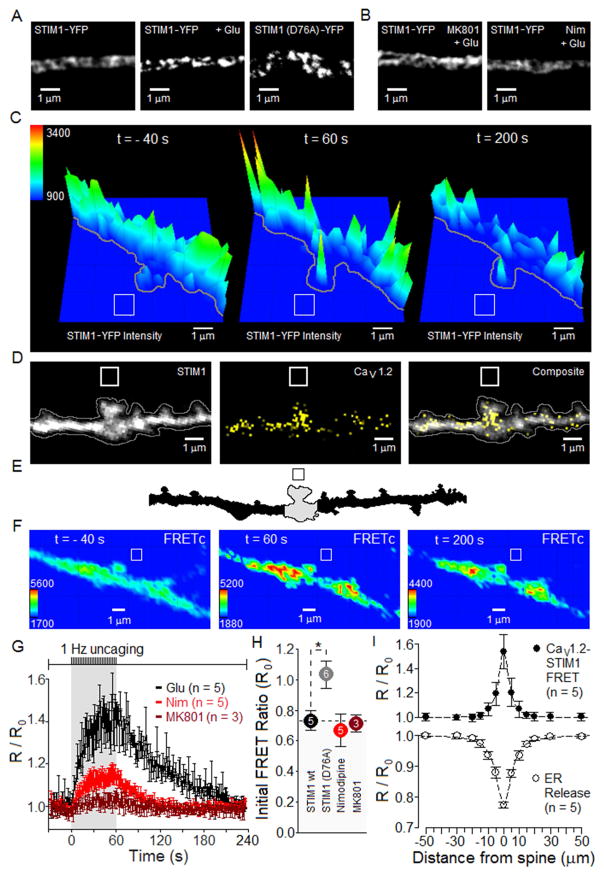
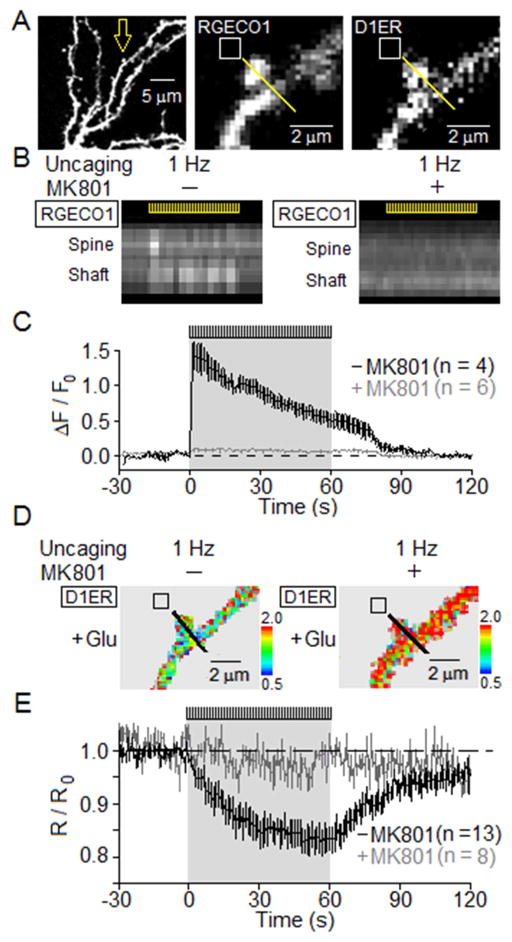
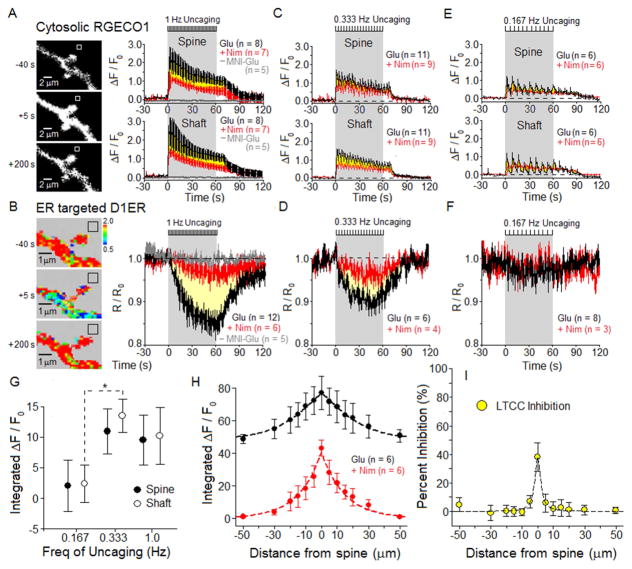
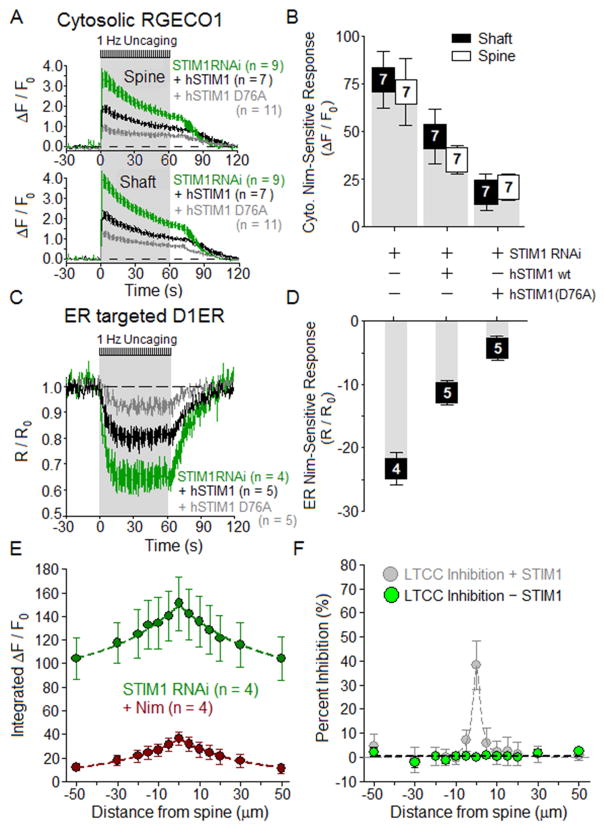
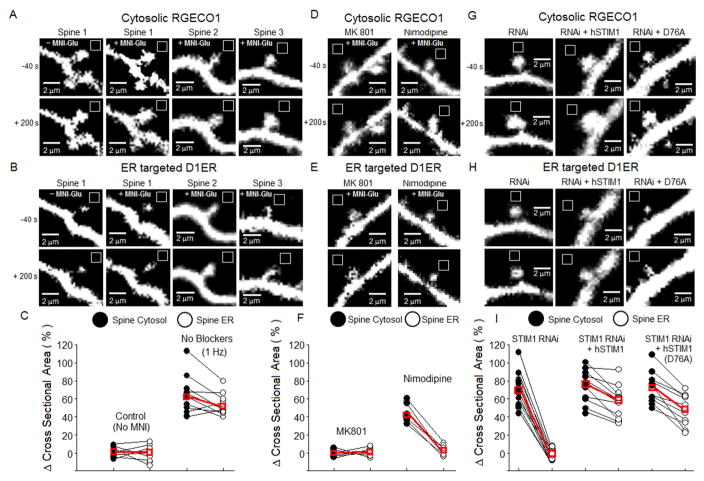
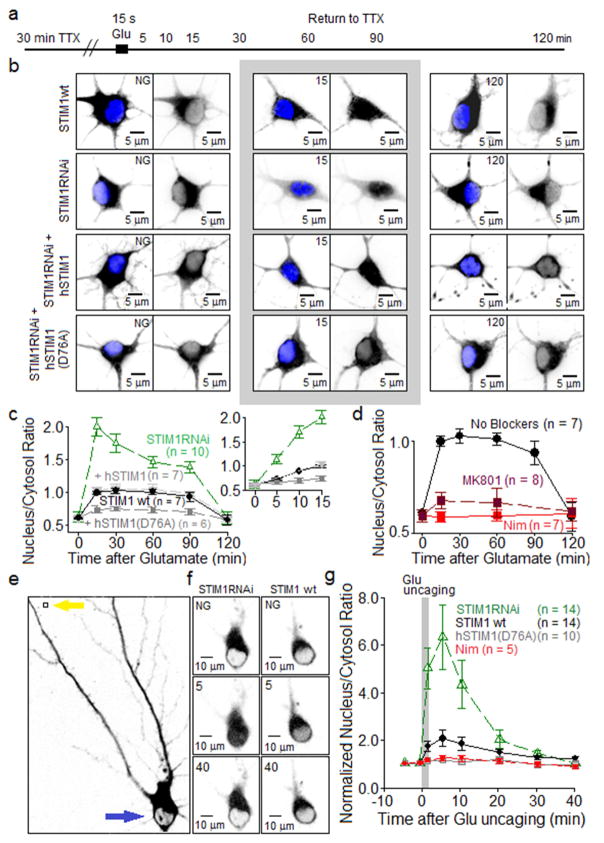
Potentiation of synaptic strength relies on postsynaptic Ca2+ signals, modification of dendritic spine structure, and changes in gene expression. One Ca2+ signaling pathway supporting these processes routes through L-type Ca2+ channels (LTCC), whose activity is subject to tuning by multiple mechanisms. Here, we show in hippocampal neurons that LTCC inhibition by the endoplasmic reticulum (ER) Ca2+ sensor, stromal interaction molecule 1 (STIM1), is engaged by the neurotransmitter glutamate, resulting in regulation of spine ER structure and nuclear signaling by the NFATc3 transcription factor. In this mechanism, depolarization by glutamate activates LTCC Ca2+ influx, releases Ca2+ from the ER, and consequently drives STIM1 aggregation and an inhibitory interaction with LTCCs that increases spine ER content but decreases NFATc3 nuclear translocation. These findings of negative feedback control of LTCC signaling by STIM1 reveal interplay between Ca2+ influx and release from stores that controls both postsynaptic structural plasticity and downstream nuclear signaling.

Keywords: L-type Ca(2+) channel; N-methyl-D-aspartate receptor; cytoplasmic Ca(2+); dendritic spine; endoplasmic reticulum; glutamate; nuclear factor of activated T cells; stromal interaction molecule 1; structural plasticity; voltage-gated Ca(2+) channel.


Figures

Figure 1
Figure 1. Inhibition of L-Type Ca2+ current by NMDARs relies upon CICR and STIM1
(A) Left, records of L currents (500-ms depolarization, −60 mV to +10 mV) before (black) and after (gray) glutamate application. Right, current-voltage relationship before (black) and after (gray) glutamate application and during block by 5 μM nimodipine (red). (B) Time course of inhibition of normalized L currents by 15 s application of glutamate (100 μM) + glycine (1 μM), for trains of 500 ms steps at 1 every 15 s (○). Time course obtained with 500 ms step depolarizations was fit with an exponential function (0–360 s). Time course of isolated L current evoked by 50-ms tep-depolarization from −60 mV to +10 mV at 30 s intervals in response to perfusion of glutamate (100 μM, △) or NMDA (100 μM, ■), + 1 μM glycine. See also Figure S1. (C,D) Pharmacological analysis of LTCC inhibition by 15 s glutamate application. Concentrations: 10 μM MK801, 25 μM DNQX, 25 μM MTEP, and 10 mM BAPTA substituted for 10 mM EGTA in the patch pipet. Percent inhibition (at time > 200 s) of L current by glutamate either alone or under conditions of BAPTA, MK801, DNQX or MTEP treatment. Glu control (n = 5), BAPTA (n = 6), MK801 (n = 5), MTEP (n = 6) and DNQX (n = 6). (E) Time course of glutamate inhibition of normalized L current in neurons transfected with a short hairpin RNAi that suppressed endogenous STIM1 expression (STIM1RNAi; green), as compared to control (black) and rescue with human STIM1 (hSTIM1 rescue; gray). Data providing estimate of percent knockdown of STIM1 by RNAi presented in Figure S2. (F) For the same conditions as in (E), steady inhibition (t > 200 s) of peak Ca2+ current density (pA/pF), calculated by dividing peak Ca2+ current (pA) by a measure of membrane surface area, cell capacitance (pF). rSTIM1 (n = 6), RNAi (n = 6) and hSTIM1 (n = 5). (G) Neuron transfected with D1ER. (H) Effects of nimodipine (5 μM) and MK801 (10 μM) on glutamate-initiated depletion of ER Ca2+ stores in neurons expressing D1ER. 100 μM glutamate + 1 μM glycine for 15 s. Calibration in Figure S3. Throughout: neurons 4–5 DIV. Step depolarizations: 500 ms, every 15 s, except where marked as 50 ms steps (1 every 30 s). Mean ± SEM; comparisons via ANOVA and Bonferroni post-hoc correction. Significance: ***p < 0.001.
Figure 2
Figure 2. Activation of NMDARs and LTCCs promotes clustering of STIM1-YFP and FRET with CFP-CaV1.2 LTCCs
(A) TIRF images of STIM1-YFP clustering in response to bath application of glutamate (100 μM + 1 μM glycine, 15 s) compared to clustering of STIM1(D76A)-YFP. Results similar to those illustrated were obtained from: STIM1-YFP (n = 10), STIM1-YFP + Glu (n = 17) and STIM1(D76A)-YFP (n = 17) neurons. (B) MK801 (10 μM) or nimodipine (5 μM) prevented STIM1-YFP clustering in response to glutamate. Results similar to those illustrated were obtained for n = 7 MK801-treated and n = 5 nimodipine-treated neurons. (C) YFP intensity plots derived from confocal images illustrate clustering of STIM1-YFP in response to glutamate uncaging, followed by de-clustering. Uncaging protocol: 2 ms laser pulses once per second, for 1 min starting at time = 0 s. White box indicates uncaging region. Bath: 2 mM MNI-glutamate, 1 μM glycine, 3 mM CaCl2 and 0 Mg2+. For each condition, observations were obtained from 5–6 neurons, with results similar to those illustrated: no blockers (6), nimodipine (5) and MK801 (5). Figure S4 presents exemplar images illustrating prevention by MK801 or by nimodipine of glutamate uncaging-driven increases in STIM1-YFP. (D) Two-dimensional, summed-intensity projection images of STIM1-YFP and CFP-CaV1.2 expression in a dendrite. (E) Based on a differential interference contrast image, outline of the section of dendrite analyzed in (D). (F) Same dendrite as in (D–E), showing STIM1-YFP/CFP-CaV1.2 FRET images corrected for spectral bleed-through and cross-excitation (FRETC). Shown are images collected 40 s prior to onset of the 1 Hz uncaging train (−40 s), at the end of the 60 s train (60 s) and 200 s after the onset of the 60 s train (200 s). Uncaging: 1 μm x 1 μm box. (G) Time course of glutamate uncaging-driven changes in FRET between STIM1-YFP and CFP-CaV1.2. FRET ratio (R) normalized to values measured 60 s prior to the train of uncaging pulses (R0). (H) FRET ratio prior to glutamate uncaging (R0). (I) For single spines (position: 0 μm) stimulated by 1 Hz uncaging of glutamate for 60 s, average spatial extent along the adjacent dendritic shaft of CaV1.2:STIM1 FRET ratio and of ER Ca2+ depletion (D1ER signal) from experiments presented in Figure 4. Throughout: 12–14 DIV neurons. Means presented ± SEM. *p < 0.05.
Figure 3
Figure 3. Simultaneous measurement of changes in [Ca2+]cyto and [Ca2+]ER following uncaging of glutamate near a dendritic spine
Neurons (DIV 12–14) expressing both RGECO1 and D1ER were used to image [Ca2+]cyto and [Ca2+]ER. MNI-glutamate was uncaged at 1 Hz for 60 s. (A) Left, fluorescence image of neuron shows RGECO1 fills spines and dendrites. High magnification shows presence of RGECO1 (middle) and D1ER (right) in the same spine. Uncaging of MNI-glutamate was carried out in the region marked by white box. (B) In the absence (left) or presence of MK801 (right), kymographic displays of RGECO1 fluorescence (related to [Ca2+]cyto) along each of a series of line scans acquired as marked by the yellow line passing through a spine and dendritic shaft in A. Position is represented on the vertical axis (spine near top, shaft toward bottom), and time on the horizontal axis. Yellow hash marks inset at top of each kymograph indicate the 60-s period of 1 Hz uncaging. (C) For RGECO1, time course of average ΔF/F0 along the line scan in the absence (black, n = 10) of MK801 superimposed on that in the presence of MK801 (gray, n = 5). Mean ± SEM. (D) In the absence (left) or presence of MK801 (right), FRET imaging of D1ER (related to [Ca2+]ER) was carried out in the same neuron as in (A), and along the same line. (E) Time course of average total D1ER response (R/R0) along the line scan in the absence (black, n = 10) and presence of MK801 (gray, n = 5). Mean ± SEM.
Figure 4
Figure 4. Frequency dependence of LTCC-driven Ca2+ signals
For 12–14 DIV neurons expressing RGECO1 and D1ER, simultaneous imaging of [Ca2+]cyto and [Ca2+]ER was carried out for three different frequencies of glutamate uncaging: 1 Hz, 0.333 Hz and 0.167 Hz. Black hash marks at top of each time course indicate period of glutamate uncaging. Bath contained 1 μM glycine, 3 mM CaCl2 and 0 Mg2+; MNI-glutamate = 2 mM. Measurement of the time course of change in [Ca2+] was carried out in the dendritic spine or adjoining shaft. Throughout, mean ± SEM. (A) Left, black and white images of RGECO1 in a dendritic shaft with spines, collected before, during and after 1 Hz uncaging. Right, in spines or adjoining shafts, average time course of RGECO1 responses (ΔF/F0) to uncaging in the absence (black) or presence of 5 μM nimodipine (red). Yellow area between the red and black time courses represents the nimodipine-sensitive component of the [Ca2+]cyto response to uncaging. No response detected in the absence of MNI-glutamate (gray). (B) Left, pseudo color-coded FRET image of the same neuron as in A, for D1ER imaging of [Ca2+]ER. Right, average time course of [Ca2+]ER depletion from the dendritic spine and adjoining shaft, normalized to initial D1ER signal (R/R0), in the absence (black) or presence of nimodipine (red). Yellow area between the black and red time courses represents the nimodipine-sensitive component of Ca2+ release from the ER. No ER depletion detected in the absence of MNI-glutamate (gray). (C–F) Reducing uncaging frequency reduced the size of LTCC-dependent components of [Ca2+]cyto and [Ca2+]ER responses. Figure S5 presents images of dendritic spines studied using 0.333 Hz and 0.167 Hz uncaging. See also Figure S6. (G) Frequency dependence of the LTCC-dependent component of [Ca2+]cyto and [Ca2+]ER responses. To preserve fixed total stimulation, varying only frequency of stimulation, the R/R0 signals were integrated over the first 10 uncaging flashes, with the flashes presented at 0.167, 0.333 or 1 Hz (integration periods of 60, 30 or 10s). (H) For single spines (at 0 μm) stimulated by 1 Hz uncaging for 60 s: extent along the adjacent dendritic shaft of total (black) and nimodipine-insensitive (red) time-integrated RGECO1 Ca2+ signals (reflecting [Ca2+]cyto) (I) Subtraction of nimodipine-insensitive signal (red) from total (black) in H, converted to percent inhibition of the nimodipine-sensitive component (reflecting region of LTCC inhibition), is plotted as a function of distance along the dendritic shaft from the stimulated spine.
Figure 5
Figure 5. STIM1 impacts L channel-dependent changes in both cytosolic and ER Ca2+
For RNAi knockdown of STIM1 (green), RNAi knockdown of STIM1 plus rescue with hSTIM1 (black), and RNAi knockdown of STIM1 plus replacement with hSTIM1 (D76A) (gray), the time courses of changes in [Ca2+] in response to 1 Hz uncaging for 60 s are displayed as mean ± SEM. (A) For STIM1 knockdown, rescue and replacement conditions, average time courses for [Ca2+]cyto responses in the dendritic spine and shaft. (B) Nimodipine-sensitive component of the peak response in dendritic spine and shaft [Ca2+]cyto calculated by subtracting Ca2+ transients after nimodipine from Ca2+ transients before nimodipine in the neurons from A. Fluorescent protein bleach prevented measurement of Ca2+ both before and after nimodipine in some neurons. (C) For STIM1 knockdown, rescue and replacement, average time courses for depletion of ER Ca2+. (D) Nimodipine-sensitive component of the uncaging-initiated release of Ca2+ from the ER, for STIM1 knockdown, rescue and replacement in neurons from C. (E) In neurons expressing STIM1 RNAi, 1 Hz uncaging for 60 s near a spine (0 μm) generated total (green) and nimodipine-insensitive (red) cytoplasmic Ca2+ signals (RGECO1) with the illustrated profiles along the dendritic shaft. (F) Subtraction of nimodipine-insensitive signal (red) from total (green) in E, converted to percent inhibition of the nimodipine-sensitive LTCC component, is plotted versus distance along the adjacent shaft (green). Data from Figure 4I (STIM1 intact) reproduced in gray.
Figure 6
Figure 6. STIM1- and LTCC-driven growth in spine ER content
In neurons (12–14 DIV) expressing both RGECO1 and D1ER, 1 Hz uncaging of glutamate increased cross-sectional areas of spines and their ER compartment. (A) RGECO1 imaging of spine cross-sectional area. (B) D1ER imaging of spine ER cross-sectional area. (C) Quantitation of spine enlargement and growth in spine ER content in response to 1 Hz uncaging. (D–F) Effects of antagonists of NMDARs (10 μM MK801) or of LTCCs (5 μM nimodipine) on uncaging-driven spine enlargement and growth in spine ER content. In F, the lines connecting filled and open symbols indicates that these measurements of spine and ER cross-sectional area were carried out in the same spine. Mean values in red. (G–I) Effect on spine enlargement and growth in ER content of STIM1 knockdown, knockdown and rescue with hSTIM1, and knockdown and replacement with constitutively active hSTIM1(D76A). Experimental data describing the growth in neighboring spine size is presented in Figure S7.
Figure 7
Figure 7. Attenuation of nuclear translocation of NFATc3 following STIM1 inhibition of L channels
(A) Following 30 min pre-incubation in TTX to silence spontaneous synaptic activity in the cultures, neurons (4–5 DIV) were stimulated by 15 s application of 100 μM glutamate + 1 μM glycine. Neurons were returned to TTX-containing solution until fixed at times indicated in the schematic. (B) Two-dimensional, summed-intensity projection images of neurons expressing GFP-NFATc3 and stained with anti-GFP (black) and, to visualize the nucleus, DAPI (blue). Top row of images illustrates glutamate-triggered GFP-NFATc3 translocation in neurons with endogenous STIM1. Second row: STIM1RNAi neurons transfected with a short hairpin construct to suppress endogenous (rat) STIM1 expression. Third row: neurons co-expressed anti-rat STIM1RNAi and human STIM1 (hSTIM1); fourth row: neurons co-expressed anti-rat STIM1RNAi and constitutively active human STIM1 (D76A). (C) Average time courses (± SEM) of GFP-NFATc3 nuclear translocation following application of glutamate. GFP-NFATc3 distribution was measured as the ratio between nuclear and cytoplasmic fluorescence intensity. Inset: same data, expanded time scale. (D) Effects of MK801 and nimodipine on translocation of GFP-NFATc3 induced by 15 s bath application of glutamate. (E) Left, black and white image of an RGECO1a-expressing neuron before glutamate uncaging. NFAT signal indicated in black. Yellow arrow indicates site of uncaging and blue arrow indicates region where NFAT translocation was measured (neuronal soma). (F) Black and white images of somatic sGFP2-NFATc3 fluorescence intensity at three time points: before uncaging (NG = no glutamate) and at 5 min and 40 min after uncaging. Black marks NFAT signal. Left column, STIM1RNAi neurons. Right column, STIM1 wt neurons transfected with empty pSilencer vector. (G) Average time courses (± SEM) of sGFP2-NFATc3 nuclear translocation following glutamate uncaging. sGFP2-NFATc3 distribution measured as the ratio between nuclear and cytoplasmic fluorescence intensity, normalized to pre-uncaging values.

References

    1. Baba A, Yasui T, Fujisawa S, Yamada RX, Yamada MK, Nishiyama N, Matsuki N, Ikegaya Y. Activity-evoked capacitative Ca2+ entry: implications in synaptic plasticity. J Neurosci. 2003;23:7737–7741. - PMC - PubMed
    1. Bading H, Ginty DD, Greenberg ME. Regulation of gene expression in hippocampal neurons by distinct calcium signaling pathways. Science. 1993;260:181–186. - PubMed
    1. Bayazitov IT, Richardson RJ, Fricke RG, Zakharenko SS. Slow presynaptic and fast postsynaptic components of compound long-term potentiation. J Neurosci. 2007;27:11510–11521. - PMC - PubMed
    1. Bliss TV, Collingridge GL. A synaptic model of memory: long-term potentiation in the hippocampus. Nature. 1993;361:31–39. - PubMed
    1. Blundon JA, Zakharenko SS. Dissecting the components of long-term potentiation. Neuroscientist. 2008;14:598–608. - PMC - PubMed

Publication types

MeSH terms

LinkOut - more resources