. 2017 Apr 11;112(7):1417-1430.
doi: 10.1016/j.bpj.2017.02.032.

Interdigitation between Triglycerides and Lipids Modulates Surface Properties of Lipid Droplets

Affiliations

Interdigitation between Triglycerides and Lipids Modulates Surface Properties of Lipid Droplets

Amélie Bacle et al. Biophys J. .

Abstract

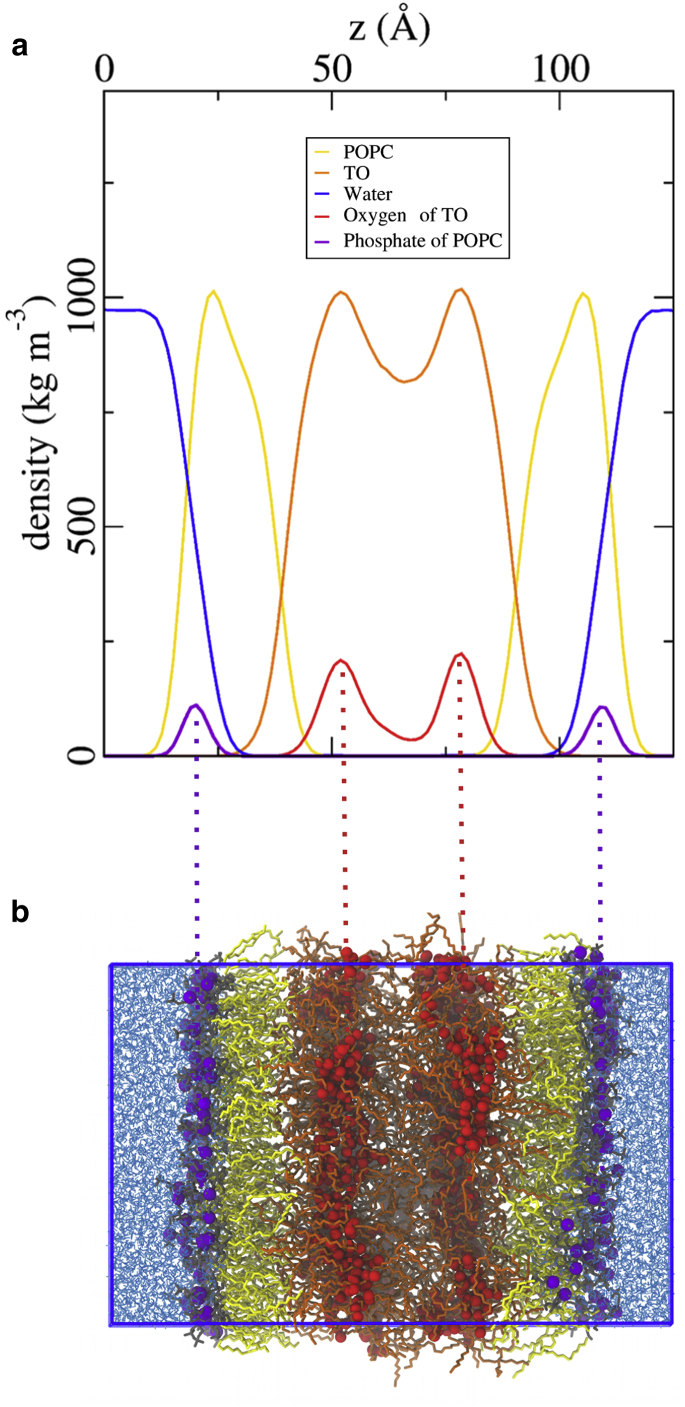
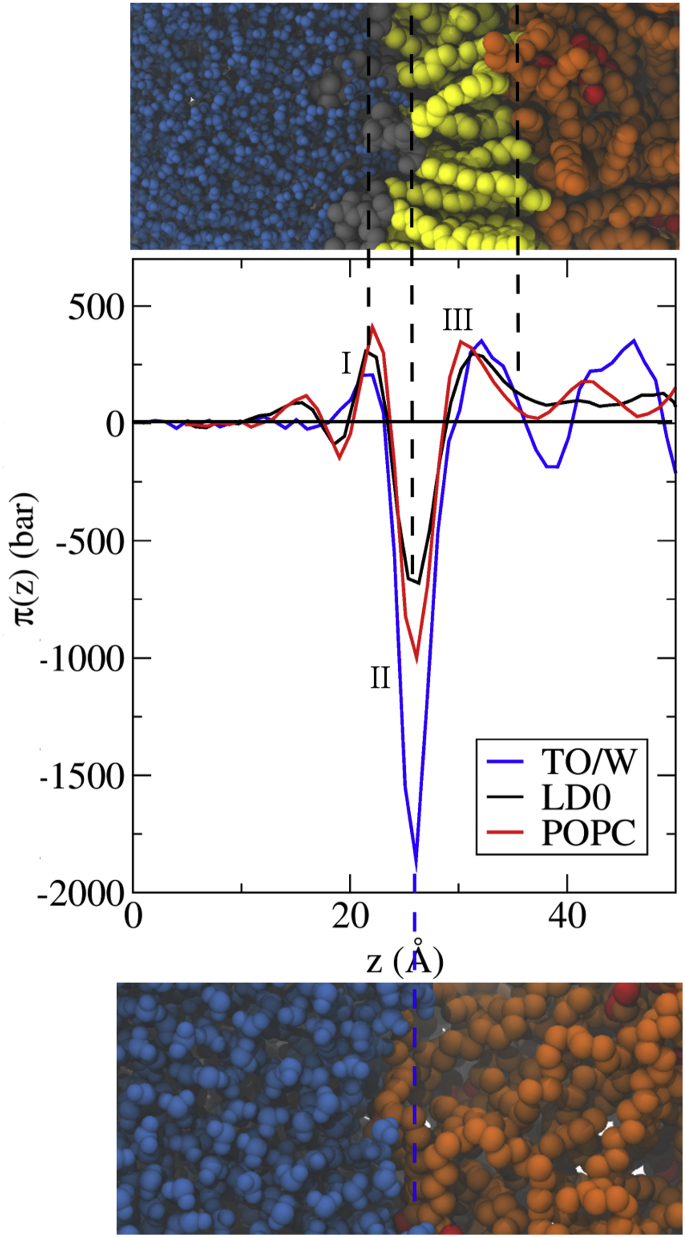
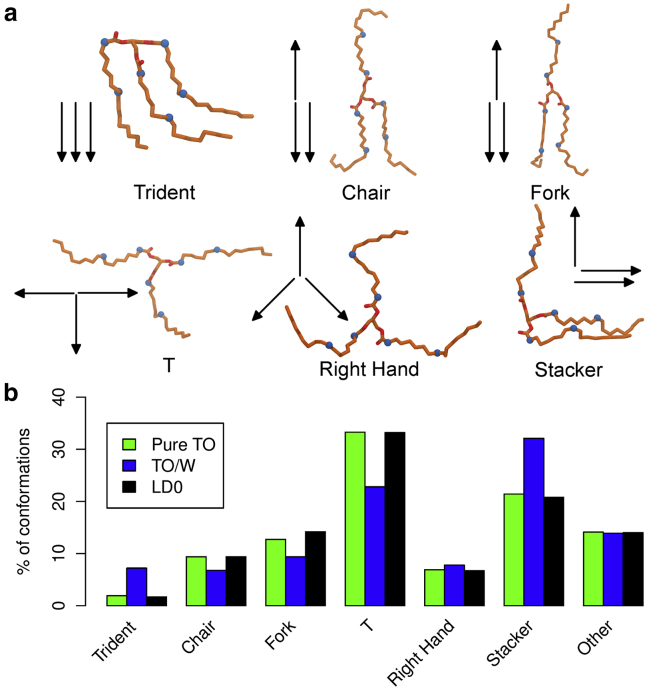
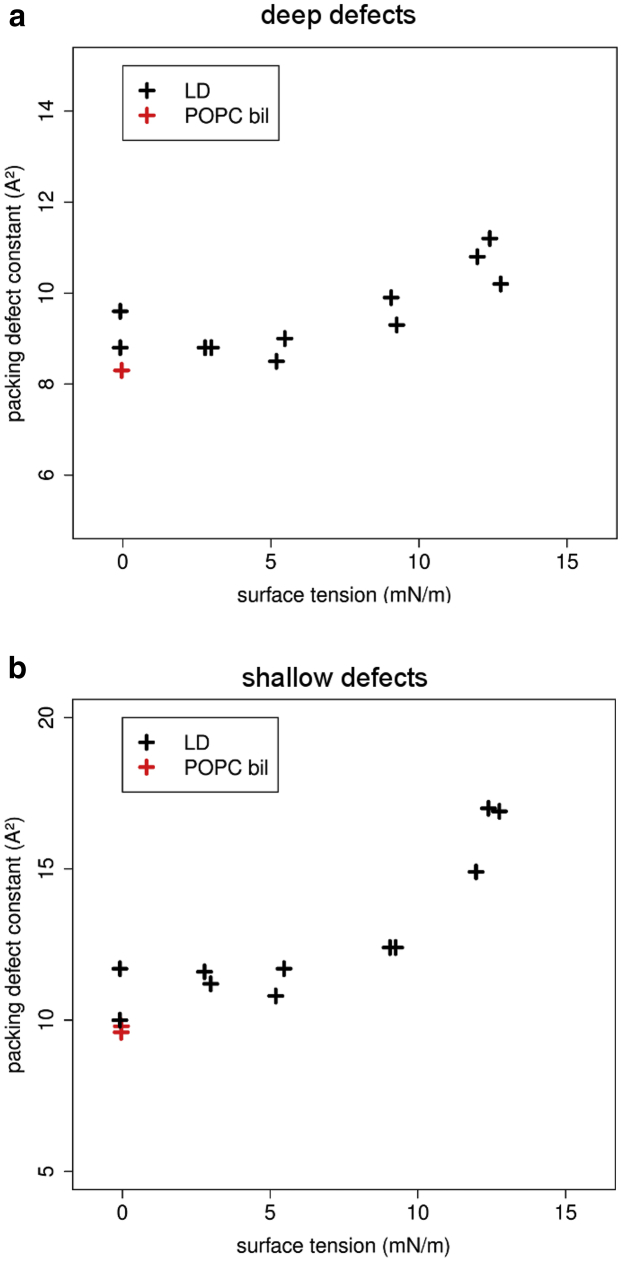
Intracellular lipid droplets (LDs) are the main cellular site of metabolic energy storage. Their structure is unique inside the cell, with a core of esterified fatty acids and sterols, mainly triglycerides and sterol esters, surrounded by a single monolayer of phospholipids. Numerous peripheral proteins, including several that were previously associated with intracellular compartments surrounded by a lipid bilayer, have been recently shown to target the surface of LDs, but how they are able to selectively target this organelle remains largely unknown. Here, we use atomistic and coarse-grained molecular dynamics simulations to investigate the molecular properties of the LD surface and to characterize how it differs from that of a lipid bilayer. Our data suggest that although several surface properties are remarkably similar between the two structures, key differences originate from the interdigitation between surface phospholipids and core neutral lipids that occurs in LDs. This property is extremely sensitive to membrane undulations, unlike in lipid bilayers, and it strongly affects both lipid-packing defects and the lateral pressure profile. We observed a marked change in overall surface properties for surface tensions >10 mN/m, indicative of a bimodal behavior. Our simulations provide a comprehensive molecular characterization of the unique surface properties of LDs and suggest how the molecular properties of the surface lipid monolayer can be modulated by the underlying neutral lipids.


Figures

Figure 1
Figure 1
Typical structure of an LD system using UA simulations. (a) Density plot corresponding to the snapshot of the LD0 trilayer system in (b). To see this figure in color, go online.
Figure 2
Figure 2
Comparison between the LPPs of a POPC bilayer, an LD ternary system, and a TO/water interface in UA simulations. (Top) Snapshot of an LD interface. (Middle) LPPs aligned on the negative peak (II). (Bottom) Snapshot of the TO/W system. The two snapshots give an approximate view of where the different peaks occur. The three important peaks are labeled I, II, and III (see text). To see this figure in color, go online.
Figure 3
Figure 3
Conformational analysis of TO molecules in UA simulations. (a) Snapshots of the different ideal conformational classes. Also shown are the names of the different classes and arrow sketches of them. (b) Comparison of the different TO conformational populations between three systems (pureTO, TO/W, and LD0). For all conformational classes and simulations, the error was systematically <0.2%. Numerical values and error are detailed in Table S11. To see this figure in color, go online.
Figure 4
Figure 4
Packing-defect constants as a function of ST in UA simulations. (a) Deep packing defects. These defects extend at least 1 Å below the average z-level of glycerol atoms. (b) Shallow packing defects. These defects are above the set threshold of 1 Å below the average z-level of glycerol atoms. The higher the packing-defect constant, the higher the probability of making large defects (10). In this figure, each cross represents an average of both ST and packing-defect constant over one simulation. For better clarity, uncertainties are not represented. Tabulated values and uncertainties for each simulation are detailed in Table S12. To see this figure in color, go online.
Figure 5
Figure 5
Conformational analysis of TO molecules in CG-SDK simulations. Shown is a comparison between the CG and UA analyses of TO conformational populations in the three main systems discussed in the text: pureTO, TO/W, and LD. With the sole exception of “Fork” conformations, the CG model reproduces accurately all of the UA populations. For all conformational classes and simulations, the uncertainty was systematically <0.2%. Numerical values are detailed in Table S14. To see this figure in color, go online.
Figure 6
Figure 6
Size dependence of LPPs in LD systems in CG-SDK simulations. (Top) Snapshot of an LD interface. (Bottom) Lateral pressure along the membrane normal. Two positive peaks (repulsion between the polar heads of phospholipids (I) and between the POPC acyl chains and the TO molecules (III)) and one negative peak (attraction between the POPC molecules at their hydrophilic/hydrophobic interface (II)) can be observed. The xy surface area of the LD “UA size” model (black dotted line) is one-fourth that of the LD system (black solid line). The LPP of a pure POPC bilayer using the CG force field is shown for comparison. To see this figure in color, go online.
Figure 7
Figure 7
Effect of ST on LD surface properties in CG-SDK simulations. (a) Pressure-area (Π-A) isotherm of LDs. The surface pressure is defined as Π = γγ0, where γ0 = 32 ± 0.1 mN/m is the ST of TO at the TO/W interface (see Table 4). (b) Deep and shallow lipid-packing defects as a function of ST in model LDs. (c) Interdigitation as a function of ST in model LDs. To see this figure in color, go online.
Figure 8
Figure 8
Effect of ST on the LPPs of model LDs in CG-SDK simulations. (Top) Snapshot of an LD interface. (Bottom) Lateral pressure as a function of the ST. The positive peak between the polar heads of phospholipids (I) is not affected by ST, whereas major changes can be observed in the negative attractive peak at the hydrophilic/hydrophobic interface of POPC molecules (II). Also, variations in height and shape can be observed in the positive peak between the POPC acyl chains and the TO molecules (III), in particular for values >10 mN/m (purple and red lines). The integral of this peak (inset) is quite constant for low ST but shows a substantial decrease from 10 mN/m to higher STs. The LPP of a TO/W interface using the CG model is shown for comparison. To see this figure in color, go online.

References

    1. Walther T.C., Farese R.V., Jr. Lipid droplets and cellular lipid metabolism. Annu. Rev. Biochem. 2012;81:687–714. - PMC - PubMed
    1. Herker E., Ott M. Emerging role of lipid droplets in host/pathogen interactions. J. Biol. Chem. 2012;287:2280–2287. - PMC - PubMed
    1. Thiam A.R., Farese R.V., Jr., Walther T.C. The biophysics and cell biology of lipid droplets. Nat. Rev. Mol. Cell Biol. 2013;14:775–786. - PMC - PubMed
    1. Soni K.G., Mardones G.A., Bonifacino J.S. Coatomer-dependent protein delivery to lipid droplets. J. Cell Sci. 2009;122:1834–1841. - PMC - PubMed
    1. Krahmer N., Guo Y., Walther T.C. Phosphatidylcholine synthesis for lipid droplet expansion is mediated by localized activation of CTP:phosphocholine cytidylyltransferase. Cell Metab. 2011;14:504–515. - PMC - PubMed

LinkOut - more resources