Quantitative Analysis of Immunohistochemistry in Melanoma Tumors
- PMID: 28403073
- PMCID: PMC5403070
- DOI: 10.1097/MD.0000000000006432
Quantitative Analysis of Immunohistochemistry in Melanoma Tumors
Abstract
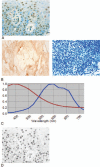
Identification of positive staining is often qualitative and subjective. This is particularly troublesome in pigmented melanoma lesions, because melanin is difficult to distinguish from the brown stain resulting from immunohistochemistry (IHC) using horse radish peroxidase developed with 3,3'-Diaminobenzidine (HRP-DAB). We sought to identify and quantify positive staining, particularly in melanoma lesions. We visualized G-protein coupled estrogen receptor (GPER) expression developed with HRP-DAB and counterstained with Azure B (stains melanin) in melanoma tissue sections (n = 3). Matched sections (n = 3), along with 22 unmatched sections, were stained only with Azure B as a control. Breast tissue (n = 1) was used as a positive HRP-DAB control. Images of the stained tissues were generated using a Nuance Spectral Imaging Camera. Analysis of the images was performed using the Nuance Spectral Imaging software and SlideBook. Data was analyzed using a Kruskal-Wallis one way analysis of variance (ANOVA). We showed that a pigmented melanoma tissue doubly stained with anti-GPER HRP-DAB and Azure B can be unmixed using spectra derived from a matched, Azure B-only section, and an anti-GPER HRP-DAB control. We unmixed each of the melanoma lesions using each of the Azure B spectra, evaluated the mean intensity of positive staining, and examined the distribution of the mean intensities (P = .73; Kruskal-Wallis). These results suggest that this method does not require a matched Azure B-only stained control tissue for every melanoma lesion, allowing precious tissues to be conserved for other studies. Importantly, this quantification method reduces the subjectivity of protein expression analysis, and provides a valuable tool for accurate evaluation, particularly for pigmented tissues.
Conflict of interest statement
The authors have no conflicts of interest to disclose.
Figures


References
-
- Brandtzaeg P. The increasing power of immunohistochemistry and immunocytochemistry. J Immunol Methods 1998;216:49–67. - PubMed
-
- Stack EC, Wang C, Roman KA, et al. Multiplexed immunohistochemistry, imaging, and quantitation: a review, with an assessment of Tyramide signal amplification, multispectral imaging and multiplex analysis. Methods 2014;70:46–58. - PubMed
Publication types
MeSH terms
Substances
Grants and funding
LinkOut - more resources
Full Text Sources
Other Literature Sources
Medical

