. 2017 Apr 12;15(4):e2001210.
doi: 10.1371/journal.pbio.2001210. eCollection 2017 Apr.

A novel mechanism of cone photoreceptor adaptation

Affiliations

A novel mechanism of cone photoreceptor adaptation

Marcus H C Howlett et al. PLoS Biol. .

Abstract

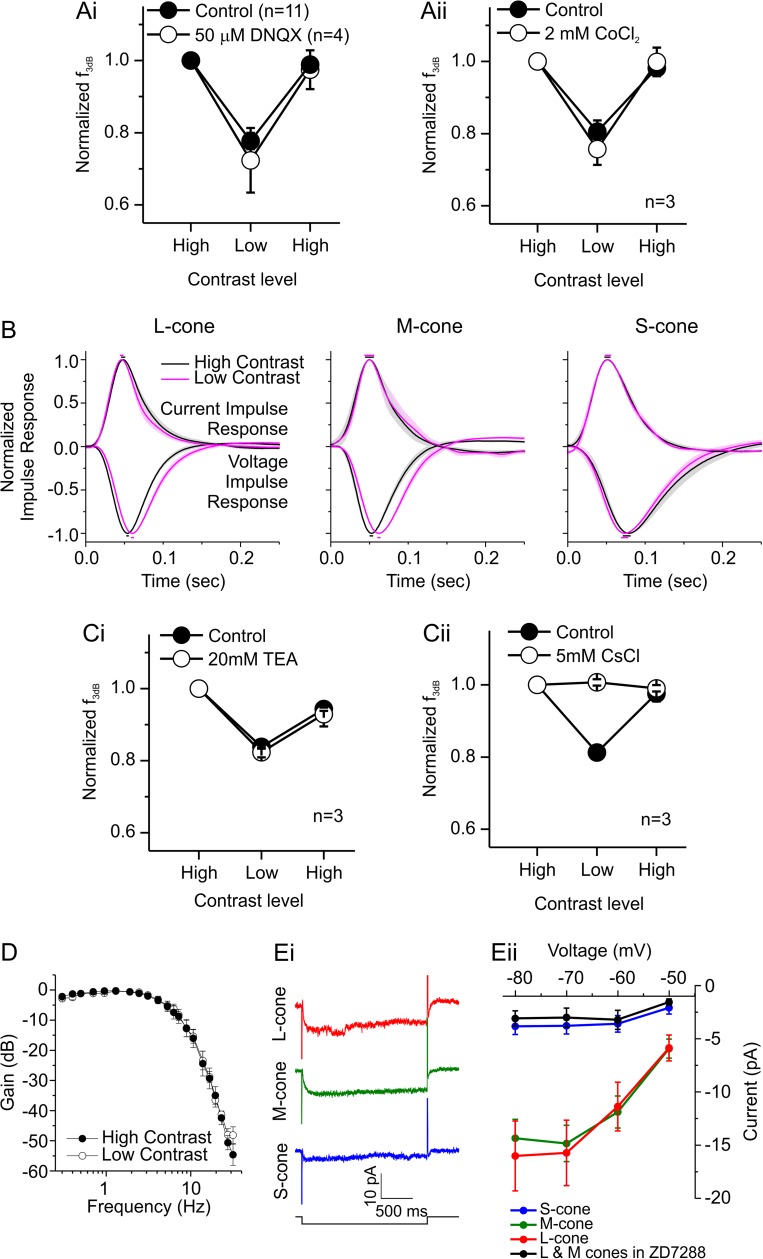
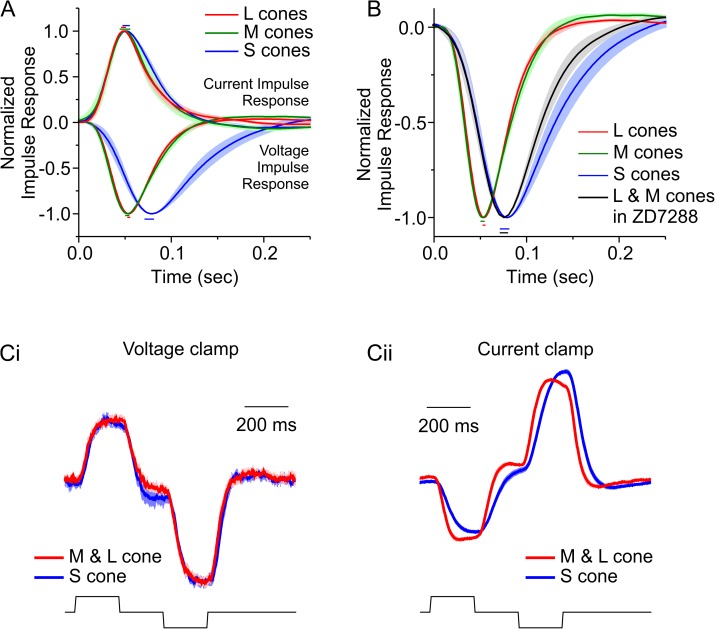
An animal's ability to survive depends on its sensory systems being able to adapt to a wide range of environmental conditions, by maximizing the information extracted and reducing the noise transmitted. The visual system does this by adapting to luminance and contrast. While luminance adaptation can begin at the retinal photoreceptors, contrast adaptation has been shown to start at later stages in the retina. Photoreceptors adapt to changes in luminance over multiple time scales ranging from tens of milliseconds to minutes, with the adaptive changes arising from processes within the phototransduction cascade. Here we show a new form of adaptation in cones that is independent of the phototransduction process. Rather, it is mediated by voltage-gated ion channels in the cone membrane and acts by changing the frequency response of cones such that their responses speed up as the membrane potential modulation depth increases and slow down as the membrane potential modulation depth decreases. This mechanism is effectively activated by high-contrast stimuli dominated by low frequencies such as natural stimuli. However, the more generally used Gaussian white noise stimuli were not effective since they did not modulate the cone membrane potential to the same extent. This new adaptive process had a time constant of less than a second. A critical component of the underlying mechanism is the hyperpolarization-activated current, Ih, as pharmacologically blocking it prevented the long- and mid- wavelength sensitive cone photoreceptors (L- and M-cones) from adapting. Consistent with this, short- wavelength sensitive cone photoreceptors (S-cones) did not show the adaptive response, and we found they also lacked a prominent Ih. The adaptive filtering mechanism identified here improves the information flow by removing higher-frequency noise during lower signal-to-noise ratio conditions, as occurs when contrast levels are low. Although this new adaptive mechanism can be driven by contrast, it is not a contrast adaptation mechanism in its strictest sense, as will be argued in the Discussion.


Conflict of interest statement

The authors have declared that no competing interests exist.

Figures

Fig 1
Fig 1. L- and M-cones adapt to contrast—natural time series of chromatic intensity (NTSCI).
(A) Power spectral density of the long- (red) and mid- (green) wavelength sensitive cone photoreceptors (L- and M-cones) -specific NTSCI stimuli. (Bi) A small section of the two cone-specific versions of the NTSCI and the corresponding response (Bii) of a representative L- (red) and M- (green) cone. (C, D) The mean ± standard error of the mean (SEM) impulse-response functions (C) and normalized frequency response amplitude (D) of four L- and four M-cones under the NTSCI condition. C and D are both representations of the characteristics of the stimulus-response transfer function to the entire NTSCI (i.e., the full 40 s). In C, the SEMs of the peak amplitudes are indicated by the color-coded vertical bars, and the SEMs for the time that the maximal peak value occurs (time to peak, T2P) are indicated by the color-coded horizontal bars. Dii shows the data on a linear frequency axis to highlight the differences at higher frequencies, and Di shows the method for determining the frequency at which the frequency response amplitude had dropped by −3dB (f3dB). (E) Upper, the L- and M-cone-specific NTSCI stimuli. Lower, the T2P of impulse-response functions calculated over 1-s periods at random locations during the NTSCI for a representative L- and M-cone. Arrowheads indicate two areas where the M-cone T2P occurred sooner than for the L-cone. The data to generate this figure can be found in S1 Data.
Fig 2
Fig 2. Joint and conditional probability maps.
(Ai) The joint (heat map) and marginal (line graphs) probabilities for the “effective” local mean light intensity (luminosity) levels and the impulse-response time to peak (T2P) for the representative long- wavelength sensitive cone photoreceptor (L-cone) shown in Fig 1E. Also shown are the forward (Aii, left) and reverse (Aii, right) conditional probabilities for the same values shown in Ai. Overall, A indicates a statistical independence between the two variables. (Bi) The joint (heat map) and marginal probabilities (line graphs) for “effective” contrast levels and the impulse-response T2P for the representative L-cone shown in Fig 1E. Also shown are the forward (Bii, left) and reverse (Bii, right) conditional probabilities for the same values shown in Bi. Overall, B indicates a statistical dependency between the two variables. For both A and B, calculations were performed over 1-s periods starting at the locations shown in Fig 1E. The same analyses of the representative mid- wavelength sensitive cone photoreceptor (M-cone) shown in Fig 1E are given in S1B and S1C Fig. See Materials and Methods and S6 Fig for the definition of “effective” local mean light intensity and “effective” contrast. The data to generate this figure can be found in S1 Data.
Fig 3
Fig 3. Contrast modulates the cone frequency response—sum of sinusoids (SoS) stimuli.
(A) The light intensity pattern of the high-contrast SoS stimulus generated by summing 21 different frequency sinusoids with equal amplitude and randomized phase (upper trace, also see S2 Fig) and a long-wavelength sensitive cone photoreceptor’s (L-cone’s) response to this stimulus (lower trace). (B) Normalized frequency response amplitudes on a linear frequency scale for L- (left panel), mid- (middle panel), and short- (right panel) wavelength sensitive cone photoreceptors (M- and S- cones) in high- (filled symbols) and low- (open symbols) contrast conditions. Both L- and M-cones attenuated the higher frequency aspects of the stimuli less in high-contrast conditions than in low (see S2 Table for quantification). S-cones did not show this behavior. Instead, they heavily attenuated the higher frequencies of the stimulus in both contrast conditions. (Ci) a SoS stimulus generated by summing 18 sinusoids of different frequency sinusoids that switched from high to low temporal contrast at 8 s and then switched back to high contrast at 16 s (top trace) and a resulting L-cone response (bottom trace). Here and in all following experiments using switching stimuli, the results for L- and M-cones are pooled. (Cii) The mean spectrogram of 11 L- and M-cones shows that the cutoff frequencies at several gain levels (−3 dB (f3dB), −10 dB, and −20 dB, black lines) become lower when the stimulus switches from high to low contrast and become higher when the stimulus contrast switches back from low contrast to high. On average, switching contrast levels shifted f3dB by 22% (Ciii) where each cone’s f3dB during the first 0-to-4-s period was used to normalize each subsequent f3dB (see text for statistics). (D) The time course of adaptation. The upper panel shows the measured cone response f3dB every 250 ms (purple trace) and a smoothed version of the response (black trace). The middle panel compares the measured cone response f3dB with the f3dB of a stimulated cone response (red, see text and S4 Fig for details). In the lower panel, the f3dB of the cone-derived filters used to generate the simulated cone response are given in 5-ms steps. Our simulation of the cone response suggests L- and M-cones start changing their frequency response characteristics within 100 ms of a contrast change. The adaptation process takes around 1 s to complete. Furthermore, it illustrates an asymmetry in the adaptation process. Data in B, Ciii, and D (upper) are shown as mean ± standard error of the mean (SEM). For B, frequency responses were generated using a 20-s window starting 2 s after the SoS stimulus onset. The stimulus was repeated multiple times (S1 Table) at one contrast level, and the average frequency response for each cone used. This procedure was then repeated at the other contrast level. The order of presentation was pseudorandom. See also S1 Table, S2 Table, S2 Fig, and S3 Fig. For C and D, the frequency responses were generated using 4-s windows every 2 s (C) or every 250 ms (D), and the data points shown correspond to the preceding 4-s interval. The stimulus was repeated 8 ± 1.1 times, and the average frequency response for each cone used. The data to generate this figure can be found in S1 Data.
Fig 4
Fig 4. Adaptation depends on the frequency distribution of the stimulus.
(A) A white noise (WN) stimulus that switches from high to low contrast and back again (upper) and a resulting long- wavelength sensitive cone photoreceptor (L-cone) response (lower). (B) The mean ± standard error of the mean (SEM) normalized f3dB for three cones that experienced both the WN and the sum-of-sinusoids (SoS) (Fig 3Ci) contrast-switching stimuli. While f3dB decreased when the SoS stimulus shifted from high contrast to low and increased when contrast switched back to high, f3dB was unaffected when the WN stimulus switched between contrast levels. Panel C shows the β0 (black), β1 (blue), and β1* (red) stimuli in the upper panel, and an L-cone’s response to these stimuli is shown in the lower panel. The spectral power density of β0 was equal across all frequencies used, whereas it declined in a 1/f1 manner for β1 (D). β1* was a higher-contrast version of β1, generated by simply increasing the power of each frequency used by an equal amount. (E) The mean ± SEM response range (red), f3dB (green), and integration time (blue) while under the β0, β1, or β1* stimuli. In each case, the data are normalized to the value obtained during the β0 condition. Seven mid- and long-wavelength sensitive cone photoreceptors (M- and L- cones) experienced both the β0 and the β1 stimuli, and five experienced both the β0 and the β1* stimuli. Note that the axes have been scaled so that the means for each response variable can be seen. The data to generate this figure can be found in S1 Data.
Fig 5
Fig 5. Localizing the adaptation mechanism.
(A) The normalized f3dB of long- and mid-wavelength sensitive cone photoreceptors (L- and M-cones) for contrast-level switches while blocking either cone input to horizontal cells with 6,7-dinitroquinoxaline-2,3-dione (DNQX, Ai) or cone synaptic transmission with CoCl2 (Aii). In both cases, switching contrast levels shifted f3dB by the same proportion in both control and drug conditions, suggesting that adaptation is an intrinsic property of L- and M-cones. Note that the control data shown in Ai are for cells from Fig 3C, as stable light responses could not be maintained long enough for both control and DNQX conditions within the same cones. (B) Normalized current and voltage impulse-response functions of long-, mid-, and short-wavelength sensitive cone photoreceptors (L-, M-, and S-cones) when stimulated with two contrast levels (non-normalized results shown in S3C and S3D Fig). The current impulse responses are independent of contrast, while for the voltage impulse responses, high contrast speeds up L- and M-cone responses, but not S-cone responses (see S3 Table for quantification). These results suggest voltage-activated processes in the membrane of L- and M-cones allow them to adapt to contrast, and S-cones may lack these processes. (C) The normalized f3dB of L- and M-cones when contrast levels switch and voltage-activated currents are blocked pharmacologically. Compared to control conditions, f3dB shifted by the same percentage when in the presence of 20 mM of tetraethylammonium (TEA) (Ci), a blocker of the cone delayed rectifying potassium current (Ik). However, f3dB did not change with contrast when the hyperpolarization-activated inward rectifying current (Ih) was blocked with 5 mM CsCl (Cii). These results indicate that Ih is an important component of the L- and M- cone adaptational mechanism. (D) The normalized frequency response amplitude of L- and M- cones when stimulated with two contrast levels while in the presence of 50 μM ZD7288, a specific Ih antagonist. These L- and M-cones did not adapt to contrast, confirming the important role of Ih in adaptation (see S2 Table for quantification). (E) To quantify Ih in L-, M-, and S-cones, the light response of the cones was suppressed by a 20-μm saturating spot of white light, and their membrane potential was clamped at −40 mV and then stepped for 2 s to potentials ranging from −80 mV to −50 mV in 10 mV increments. Individual cone responses to a potential step from −40 mV to −70 mV are shown in Ei. Ih was similar for the L- and M-cones (Eii, red and green symbols, n = 14 and 18, respectively) but was significantly smaller in S-cones (Eii, blue symbols, n = 9). In addition, the S-cone current approximately matched that found for L- and M-cones in the presence of 50 μM ZD7288 (Eii, black symbols, n = 5). Data are shown as mean ± standard error of the mean (SEM) except in Ei. In panel B, the color-coded bars above and below the impulse-response functions indicate the ±SEM in the time to peak. See text for statistics unless specified elsewhere. Panels A and C used the sum-of-sinusoids (SoS) contrast-switching stimulus shown in Fig 3Ci. Panels B and D used the SoS stimulus shown in Fig 3A and the same procedure described for Fig 3B. Experiments presented in panels A, C, and D were performed in current clamp. Number of stimulus repeats used (control, drug) in Ai: 8.0 ± 1.1, 8.5 ± 1.19; Aii: 7.7 ± 1.45, 7.7 ± 1.2; Ci: 5.7 ± 0.33, 6.3 ± 1.45; and Cii: 8.3 ± 0.88, 6.7 ± 0.88. For B, see S1 Table; for D: high contrast, 6.5 ± 0.67; low contrast, 6.8 ± 0.58. The data to generate this figure can be found in S1 Data.
Fig 6
Fig 6. Comparison of light responses under the voltage- and current-clamp conditions of long-, mid-, and short- wavelength sensitive cone photoreceptors (L-, M-, and S-cones).
(A) L-, M-, and S-cone current and voltage impulse-response functions during high contrast. Current impulse responses were equal for all cone types (see S3 Table for quantification). (B) Voltage impulse responses during high contrast for L-, M-, and S-cones and for the pooled result of L- and M-cones in the presence of 50 μM ZD7288. When Ih is antagonized with ZD7288, the voltage light responses of L- and M-cones slows and closely resembles that of S-cones (see S3 Table for quantification). Panels A and B suggest that cone membrane properties (membrane capacitance) slow the light response and that voltage-gated currents such as Ih speed up the light response of L- and M-cones. Since S-cones lack a prominent Ih (Fig 5Eii), their voltage light responses remain slow. (C) When stimulated with a simple brief-light step stimulus, while the current responses of all three cone types had similar kinetics (Ci), the voltage response of S-cones was considerably slower (Cii). Panels A and B used the sum-of-sinusoids (SoS) stimulus and procedure described in Fig 3A and 3B. The L-, M-, and S-cone data are the same as shown in Fig 5B; for the ten L- and M-cones in ZD7288, the stimulus repeated 5.7 ± 0.56 times. Data for panel C were 0 to 1 normalized before averaging. All data are shown as mean ± standard error of the mean (SEM); the color-coded bars above and below the impulse-response functions indicate the ±SEM in the time to peak. The data to generate this figure can be found in S1 Data.

Similar articles

Cited by

References

    1. Mante V, Frazor RA, Bonin V, Geisler WS, Carandini M. Independence of luminance and contrast in natural scenes and in the early visual system. Nat Neurosci. 2005;8(12):1690–7. 10.1038/nn1556 - DOI - PubMed
    1. Fain GL, Matthews HR, Cornwall MC, Koutalos Y. Adaptation in vertebrate photoreceptors. Physiol Rev. 2001;81(1):117–51. - PubMed
    1. van der Schaaf A, van Hateren JH. Modelling the power spectra of natural images: statistics and information. Vision Res. 1996;36(17):2759–70. - PubMed
    1. Balboa RM, Grzywacz NM. Power spectra and distribution of contrasts of natural images from different habitats. Vision Res. 2003;43(24):2527–37. - PubMed
    1. Schneeweis DM, Schnapf JL. The photovoltage of macaque cone photoreceptors: adaptation, noise, and kinetics. J Neurosci. 1999;19(4):1203–16. - PMC - PubMed

Publication types

LinkOut - more resources