. 2017 Apr 12;12(4):e0175441.
doi: 10.1371/journal.pone.0175441. eCollection 2017.

Exercise in vivo marks human myotubes in vitro: Training-induced increase in lipid metabolism

Affiliations

Exercise in vivo marks human myotubes in vitro: Training-induced increase in lipid metabolism

Jenny Lund et al. PLoS One. .

Abstract

Background and aims: Physical activity has preventive as well as therapeutic benefits for overweight subjects. In this study we aimed to examine effects of in vivo exercise on in vitro metabolic adaptations by studying energy metabolism in cultured myotubes isolated from biopsies taken before and after 12 weeks of extensive endurance and strength training, from healthy sedentary normal weight and overweight men.

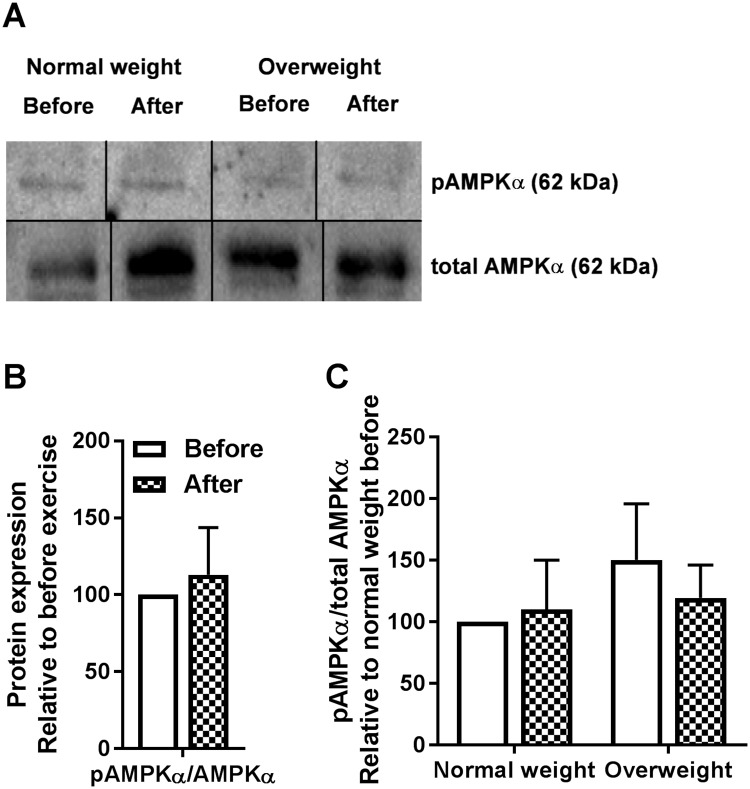
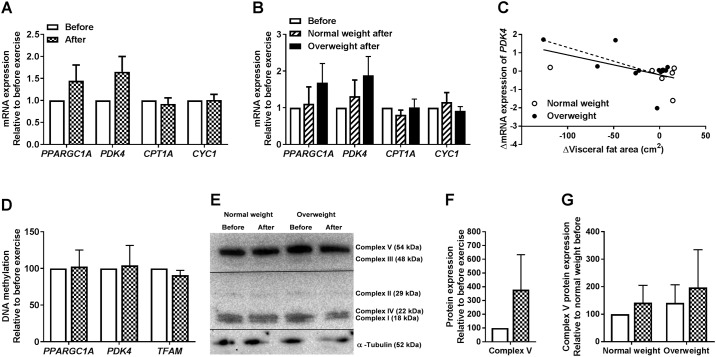
Methods: Healthy sedentary men, aged 40-62 years, with normal weight (body mass index (BMI) < 25 kg/m2) or overweight (BMI ≥ 25 kg/m2) were included. Fatty acid and glucose metabolism were studied in myotubes using [14C]oleic acid and [14C]glucose, respectively. Gene and protein expressions, as well as DNA methylation were measured for selected genes.

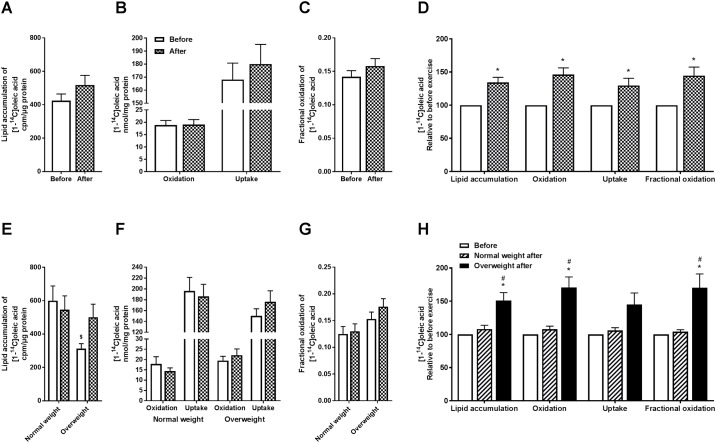
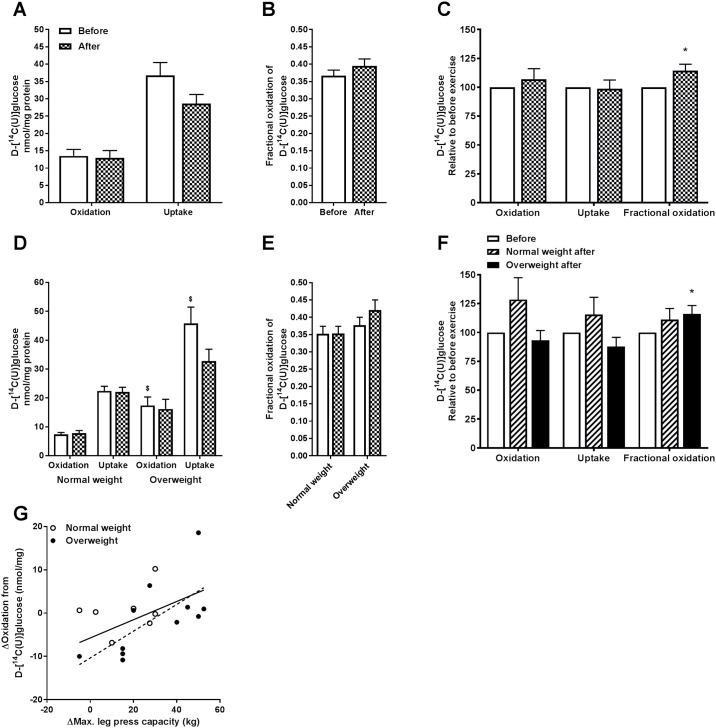
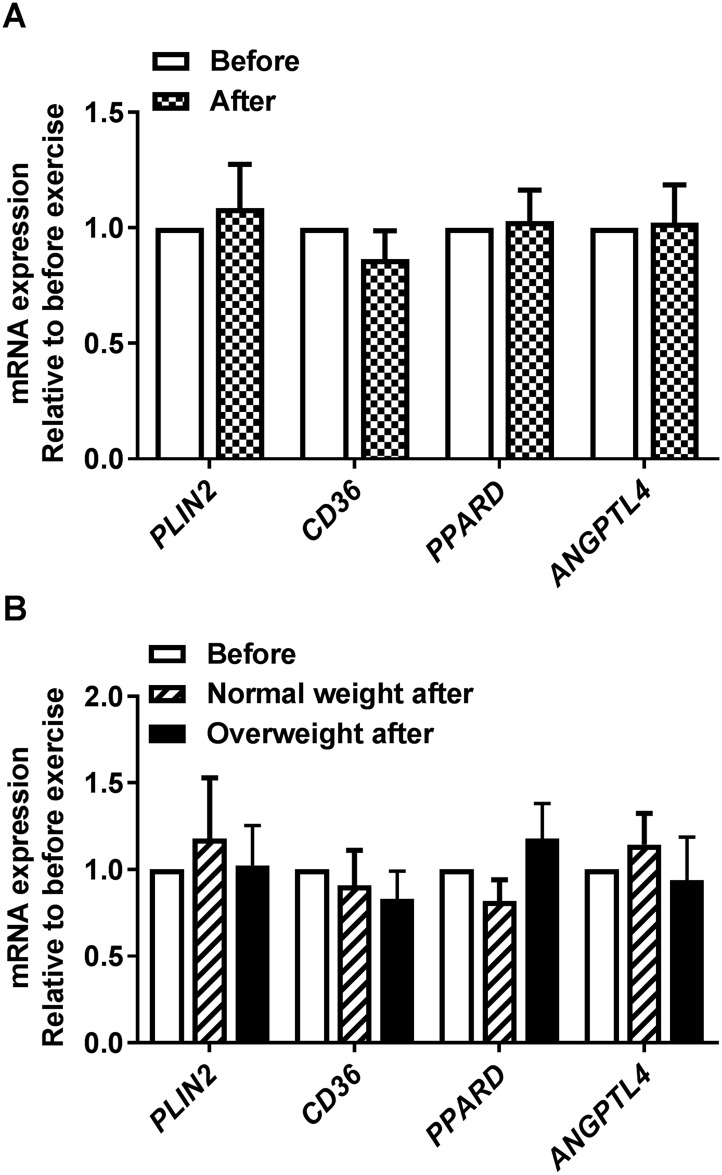
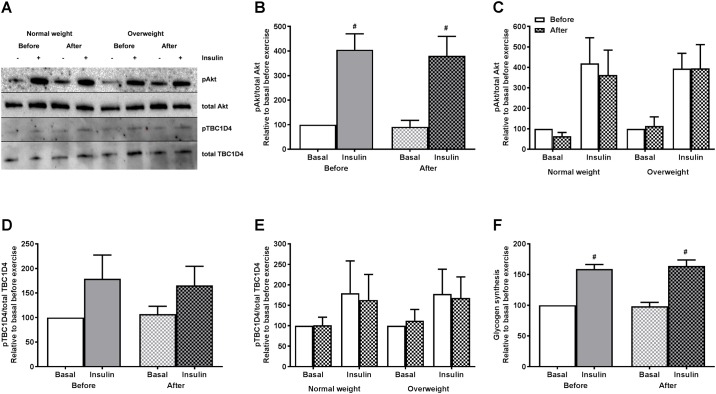
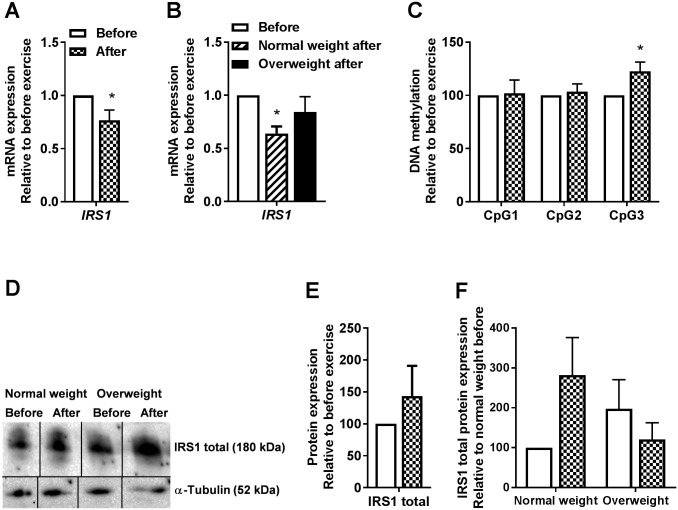
Results: The 12-week training intervention improved endurance, strength and insulin sensitivity in vivo, and reduced the participants' body weight. Biopsy-derived cultured human myotubes after exercise showed increased total cellular oleic acid uptake (30%), oxidation (46%) and lipid accumulation (34%), as well as increased fractional glucose oxidation (14%) compared to cultures established prior to exercise. Most of these exercise-induced increases were significant in the overweight group, whereas the normal weight group showed no change in oleic acid or glucose metabolism.

Conclusions: 12 weeks of combined endurance and strength training promoted increased lipid and glucose metabolism in biopsy-derived cultured human myotubes, showing that training in vivo are able to induce changes in human myotubes that are discernible in vitro.


Conflict of interest statement

Competing Interests: The authors report no conflicts of interests.

Figures

Fig 1
Fig 1. Effects of 12 weeks of exercise on myotube fatty acid metabolism.
Satellite cells isolated from biopsies from m. vastus lateralis before and after 12 weeks of exercise were cultured and differentiated to myotubes. Oxidation, cell-associated (CA) radioactivity and lipid accumulation of [14C]oleic acid were measured, and total cellular uptake (CO2+CA), oxidation (CO2), fractional oxidation (CO2CO2+CA), and lipid accumulation were determined. (A) Lipid accumulation presented as cpm/μg protein. Values are presented as means ± SEM for all participants combined (n = 18). (B) Oleic acid oxidation and total cellular uptake presented as nmol/mg protein. Values are presented as means ± SEM for all participants combined (n = 18). (C) Fractional oleic acid oxidation. Values are presented as means ± SEM for all participants combined (n = 18). (D) Fatty acid metabolism relative to before exercise. Values are presented as means ± SEM for all participants combined (n = 18). (E) Lipid accumulation presented as cpm/μg protein in study group when separated by BMI. Values are presented as means ± SEM (n = 7 in the normal weight group and n = 11 in the overweight group). (F) Oleic acid oxidation and total cellular uptake presented as nmol/mg protein in study group when separated by BMI. Values are presented as means ± SEM (n = 7 in the normal weight group and n = 11 in the overweight group). (G) Fractional oleic acid oxidation in absolute values in study group when separated by BMI. Values are presented as means ± SEM (n = 7 in the normal weight group and n = 11 in the overweight group). (H) Fatty acid metabolism relative to before exercise in study group separated by BMI. Values are presented as means ± SEM (n = 7 in the normal weight group and n = 11 in the overweight group). *Statistically significant vs. before exercise (p < 0.05, linear mixed-model analysis, SPSS). #Statistically significant vs. normal weight group after exercise (p < 0.05, linear mixed-model analysis, SPSS). $Statistically significant vs. normal weight group (p < 0.05, linear mixed-model analysis, SPSS).
Fig 2
Fig 2. Effects of 12 weeks of exercise on myotube glucose metabolism.
Satellite cells isolated from biopsies from m. vastus lateralis before and after 12 weeks of exercise were cultured and differentiated to myotubes. Oxidation and cell-associated (CA) radioactivity of [14C]glucose were measured, and total cellular uptake (CO2+CA), oxidation (CO2), and fractional oxidation (CO2CO2+CA) were determined. (A) Glucose oxidation and total cellular uptake presented as nmol/mg protein. Values are presented as means ± SEM for all participants combined (n = 18). (B) Fractional glucose oxidation. Values are presented as means ± SEM for all participants combined (n = 18). (C) Glucose metabolism relative to before exercise. Values are presented as means ± SEM for all participants combined (n = 18). *Statistically significant vs. before exercise (p < 0.05, linear mixed-model analysis, SPSS). (D) Glucose oxidation and total cellular uptake presented as nmol/mg protein in study group when separated by BMI. Values are presented as means ± SEM (n = 7 in the normal weight group and n = 11 in the overweight group). (E) Fractional glucose oxidation in absolute values in study group when separated by BMI. Values are presented as means ± SEM (n = 7 in the normal weight group and n = 11 in the overweight group). (F) Glucose metabolism relative to before exercise in study group when separated by BMI. Values are presented as means ± SEM (n = 7 in the normal weight group and n = 11 in the overweight group). *Statistically significant vs. before exercise (p < 0.05, linear mixed-model analysis, SPSS). $Statistically significant vs. normal weight group (p < 0.05, linear mixed-model analysis, SPSS). (G) Pearson’s test of correlation between exercise-induced changes in leg press and glucose oxidation in myotubes. Δ = after exercise–before exercise. Full line represents the regression line for all donors (n = 18, Pearson’s correlation coefficient, r = 0.52, and p = 0.03), whereas stapled line represents the regression line for the overweight group (n = 11, Pearson’s correlation coefficient, r = 0.68, and p = 0.02).
Fig 3
Fig 3. Effects of 12 weeks of exercise on myotube AMPKα phosphorylation.
Satellite cells isolated from biopsies from m. vastus lateralis before and after 12 weeks of exercise were cultured and differentiated to myotubes. (A-C) AMPKα phosphorylation by immunoblotting. Protein was isolated and total AMPKα and pAMPKα expressions assessed by immunoblotting. A, one representative immunoblot. Bands selected from one membrane have been spliced together to show only relevant samples, as indicated by lines separating the spliced blots. B, quantified immunoblots for participants combined (n = 9) relative to before exercise. C, quantified immunoblots for study group when separated by BMI relative to normal weight before exercise (n = 5 in the normal weight group and n = 4 in the overweight group). Values are presented as means ± SEM. All samples were derived at the same time and processed in parallel.
Fig 4
Fig 4. Effects of 12 weeks of exercise on mitochondria-related genes and proteins.
Satellite cells isolated from biopsies from m. vastus lateralis before and after 12 weeks of exercise were cultured and differentiated to myotubes. (A) mRNA expression of PPARGC1A, PDK4, CPT1A, and CYC1 after exercise relative to before exercise. mRNA was isolated and expression assessed by qPCR. All values were corrected for the housekeeping control GAPDH, and presented as means ± SEM for all participants combined (n = 18). (B) mRNA expression of PPARGC1A, PDK4, CPT1A, and CYC1 after exercise relative to before exercise in study group when separated by BMI. mRNA was isolated and expression assessed by qPCR. All values were corrected for the housekeeping control GAPDH, and presented as means ± SEM (n = 7 in the normal weight group and n = 11 in the overweight group). (C) Pearson’s test of correlation was performed between exercise-induced changes in visceral fat area and mRNA expression of PDK4 in myotubes. Δ = after exercise–before exercise. Full line represents the regression line for all donors (n = 18, Pearson’s correlation coefficient, r = -0.54, and p = 0.02), whereas stapled line represents the regression line for the overweight group (n = 11, Pearson’s correlation coefficient, r = -0.63, and p = 0.04). (D) DNA methylation of PPARGC1A, PDK4 and TFAM after exercise relative to before exercise. gDNA was isolated and bisulfite treated, and methylation assessed by immunoblotting. Values are presented as means ± SEM (n = 6). (E-G) OXPHOS complexes by immunoblotting. Protein was isolated and OXPHOS complexes assessed by immunoblotting. E, one representative immunoblot. F, quantified immunoblots of complex V for participants combined. All values were corrected for the housekeeping control α-tubulin, and presented as means ± SEM (n = 10). G, quantified immunoblots of complex V in study group when separated by BMI. All values were corrected for the housekeeping control α-tubulin, and presented as means ± SEM (n = 5 in each group).
Fig 5
Fig 5. Effects of 12 weeks of exercise on myotube expression of lipid metabolism associated genes.
Satellite cells isolated from biopsies from m. vastus lateralis before and after 12 weeks of exercise were cultured and differentiated to myotubes. mRNA was isolated and expression assessed by qPCR. (A) mRNA expression after exercise relative to before exercise for all participants combined. All values were corrected for the housekeeping control GAPDH, and presented as means ± SEM (n = 18). (B) mRNA expression after exercise relative to before exercise for study group when separated by BMI. All values were corrected for the housekeeping control GAPDH, and presented as means ± SEM (n = 7 in the normal weight group and n = 11 in the overweight group).
Fig 6
Fig 6. Effects of 12 weeks of exercise on myotube Akt phosphorylation, TBC1D4 phosphorylation and glycogen synthesis with or without 100 nmol/l insulin.
Satellite cells isolated from biopsies from m. vastus lateralis before and after 12 weeks of exercise were cultured and differentiated to myotubes. (A-C) Akt phosphorylation by immunoblotting. Protein was isolated and total Akt and pAkt expressions assessed by immunoblotting. A, one representative immunoblot. B, quantified immunoblots relative to basal before exercise for participants combined. Values are presented as means ± SEM (n = 9). C, quantified immunoblots relative to basal before exercise for study group when separated by BMI (n = 4 in the normal weight group and n = 5 in the overweight group). (A, D and E) TBC1D4 phosphorylation by immunoblotting. Protein was isolated and total TBC1D4 and pTBC1D4 expressions assessed by immunoblotting. A, one representative immunoblot. D, quantified immunoblots relative to basal before exercise for participants combined. Values are presented as means ± SEM (n = 10). E, quantified immunoblots relative to basal before exercise for study group when separated by BMI (n = 5 in both groups). All samples were derived at the same time and processed in parallel. (F) Glycogen synthesis relative to basal before exercise. Values are presented as means ± SEM (n = 5). Absolute values (range) representing 100%: Basal glycogen synthesis 3.9–15.4 nmol/mg protein. #Statistically significant vs. basal before exercise (p < 0.05, paired t test).
Fig 7
Fig 7. Effects of 12 weeks of exercise on myotube IRS1 gene expression and IRS1 first exon DNA methylation.
(A) IRS1 mRNA expression after exercise relative to before exercise for participants combined. mRNA was isolated and expression assessed by qPCR. All values were corrected for the housekeeping control GAPDH, and presented as means ± SEM (n = 8). *Statistically significant vs. before exercise (p < 0.05, paired t test). (B) IRS1 mRNA expression after exercise relative to before exercise for study group when separated by BMI. mRNA was isolated and expression assessed by qPCR. All values were corrected for the housekeeping control GAPDH, and presented as means ± SEM (n = 3 in the normal weight group and n = 5 in the overweight group). *Statistically significant vs. before exercise (p < 0.05, paired t test). (C) IRS1 first exon DNA methylation after exercise relative to before exercise. gDNA was isolated and bisulfite treated, and methylation was assessed by pyrosequencing. Values are presented as means ± SEM (n = 6). *Statistically significant vs. before exercise (p < 0.05, paired t test). (D-F) IRS1 total protein expression. Protein was isolated and total IRS1 expression assessed by immunoblotting. D, one representative immunoblot. Bands selected from one membrane have been spliced together to show only relevant samples, as indicated by lines separating the spliced blots. E, quantified immunoblots relative to before exercise for participants combined. All values were corrected for the housekeeping control α-tubulin, and presented as means ± SEM (n = 9). G, quantified immunoblots relative to before exercise for study group when separated by BMI. All values were corrected for the housekeeping control α-tubulin, and presented as means ± SEM (n = 5 in the normal weight group and n = 4 in the overweight group). All samples were derived at the same time and processed in parallel.

Similar articles

Cited by

References

    1. Ginter E, Simko V. Type 2 diabetes mellitus, pandemic in 21st century Diabetes: Springer; 2013. p. 42–50. - PubMed
    1. Tuomilehto J, Lindström J, Eriksson JG, Valle TT, Hämäläinen H, Ilanne-Parikka P, et al. Prevention of type 2 diabetes mellitus by changes in lifestyle among subjects with impaired glucose tolerance. New England Journal of Medicine. 2001;344(18):1343–50. 10.1056/NEJM200105033441801 - DOI - PubMed
    1. Alberti KGM, Zimmet P, Shaw J. International Diabetes Federation: a consensus on Type 2 diabetes prevention. Diabetic Medicine. 2007;24(5):451–63. 10.1111/j.1464-5491.2007.02157.x - DOI - PubMed
    1. James PT. Obesity: the worldwide epidemic. Clinics in dermatology. 2004;22(4):276–80. 10.1016/j.clindermatol.2004.01.010 - DOI - PubMed
    1. Smyth S, Heron A. Diabetes and obesity: the twin epidemics. Nature medicine. 2006;12(1):75–80. 10.1038/nm0106-75 - DOI - PubMed

MeSH terms