. 2017 Apr 12;18(1):290.
doi: 10.1186/s12864-017-3653-2.

Defining the transcriptomic landscape of the developing enteric nervous system and its cellular environment

Affiliations

Defining the transcriptomic landscape of the developing enteric nervous system and its cellular environment

Sweta Roy-Carson et al. BMC Genomics. .

Abstract

Background: Motility and the coordination of moving food through the gastrointestinal tract rely on a complex network of neurons known as the enteric nervous system (ENS). Despite its critical function, many of the molecular mechanisms that direct the development of the ENS and the elaboration of neural network connections remain unknown. The goal of this study was to transcriptionally identify molecular pathways and candidate genes that drive specification, differentiation and the neural circuitry of specific neural progenitors, the phox2b expressing ENS cell lineage, during normal enteric nervous system development. Because ENS development is tightly linked to its environment, the transcriptional landscape of the cellular environment of the intestine was also analyzed.

Results: Thousands of zebrafish intestines were manually dissected from a transgenic line expressing green fluorescent protein under the phox2b regulatory elements [Tg(phox2b:EGFP) w37 ]. Fluorescence-activated cell sorting was used to separate GFP-positive phox2b expressing ENS progenitor and derivatives from GFP-negative intestinal cells. RNA-seq was performed to obtain accurate, reproducible transcriptional profiles and the unbiased detection of low level transcripts. Analysis revealed genes and pathways that may function in ENS cell determination, genes that may be identifiers of different ENS subtypes, and genes that define the non-neural cellular microenvironment of the ENS. Differential expression analysis between the two cell populations revealed the expected neuronal nature of the phox2b expressing lineage including the enrichment for genes required for neurogenesis and synaptogenesis, and identified many novel genes not previously associated with ENS development. Pathway analysis pointed to a high level of G-protein coupled pathway activation, and identified novel roles for candidate pathways such as the Nogo/Reticulon axon guidance pathway in ENS development.

Conclusion: We report the comprehensive gene expression profiles of a lineage-specific population of enteric progenitors, their derivatives, and their microenvironment during normal enteric nervous system development. Our results confirm previously implicated genes and pathways required for ENS development, and also identify scores of novel candidate genes and pathways. Thus, our dataset suggests various potential mechanisms that drive ENS development facilitating characterization and discovery of novel therapeutic strategies to improve gastrointestinal disorders.

Keywords: Enteric nervous system; Hirschsprungs; Neural crest; RNA-sequencing; Transcriptome; Zebrafish; phox2b.


Figures
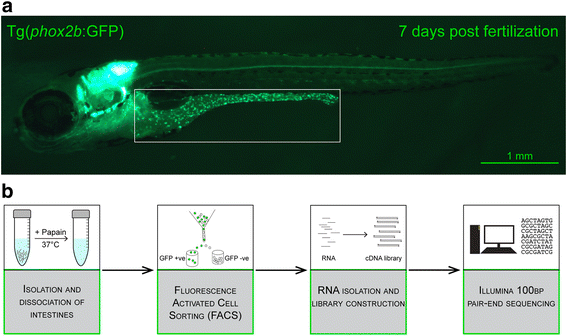
Fig. 1
Fig. 1
Image and flow chart illustrating source of GFP labeled cells, sample preparation and bioinformatics analysis. a Image of a 7 days post fertilization (dpf) zebrafish larvae of the transgenic line, Tg(phox2b:EGFP). The boxed area shows the intestine with GFP-positive enteric neurons (green dots). b Schematic diagram illustrating the experimental approach. Intestines were dissected out to avoid contamination with GFP-positive cells expressing phox2b in the hindbrain or the spinal cord. The intestines were dissociated using papain digestion followed by fluorescent activated cell sorting (FACS). RNA isolated from the sorted cell populations was used to construct cDNA libraries. Raw reads from Illumina sequencing were processed and analyzed using various bioinformatics analyses programs
Fig. 2
Fig. 2
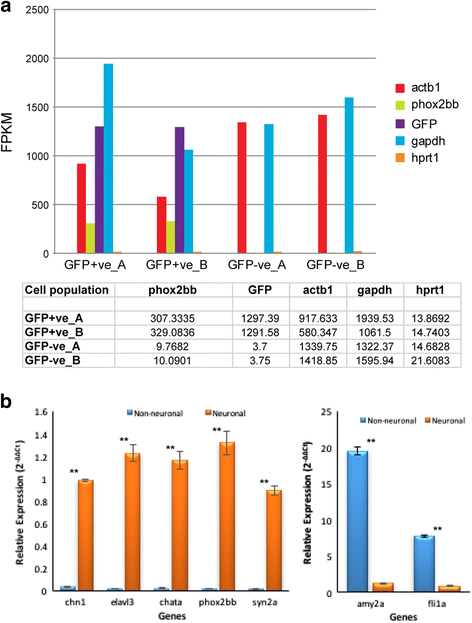
Experimental validation of reliable separation of the neuronal ENS from the non-neuronal intestinal cell population. a The bar graph (above) and corresponding data in table (below) show the expression levels in FPKM of five selected genes in the two neuronal replicate [GFP-positive_(GFP + ve) a and _b] and the two non-neuronal replicate [GFP-negative_(GFP-ve) a and _b] cell populations. GFP transcript levels show the level of GFP transcript driven from the phox2b transgene. The expression values of phox2bb measure the endogenous transcript levels of the phox2b gene. Expression levels for the three house-keeping genes actb1, gapdh, and hprt1 are also shown. (b) qPCR validation of expression levels of 7 genes comparing the GFP-positive neuronal populations (Orange bars) versus the GFP-negative non-neuronal (blue bars). chn1, elavl3, chata, phox2bb, and syn2a were more highly expressed in the neuronal population, whereas amy2a and fli1a were more highly expressed in the non-neuronal population. Changes in gene expression were calculated using 2− ΔΔCT method with hprt1 as the house- keeping gene. The mean relative expression of the neuronal population was significantly different from that of the non-neuronal population (p-value < 0.01)
Fig. 3
Fig. 3
Differential gene expression analysis of 7dpf Danio rerio enteric neurons. a and b. Plot showing the correlation between the two biological replicates of the GFP-positive neuronal population (a) and of the GFP-negative non-neuronal population (b). The x-axis represents the 1st biological replicate while the y-axis represents the 2nd biological replicate. The correlation coefficient was calculated using FPKM. The correlation coefficient for the neuronal and non-neuronal cell population is 0.95 and 0.96, respectively. c Dispersion plot showing the log2foldchange of individual reads as compared to the mean normalized counts using DESeq with the adjusted p-value ≤ 0.01. The red dots represent the upregulated/enriched and the blue dots represent downregulated/depleted genes in the neuronal cells of the zebrafish intestine. d. Heat map of the normalized counts for the 4418 DEGs between neuronal and non-neuronal cell populations. The thresholds selected are FDR ≤ 0.01 and log2foldchange ≥ 1.5. The first two columns represent biological replicates (a and b) of the non-neuronal cell population and the second two columns represent biological replicates (a and b) of the neuronal population. Each row denotes a single gene and their expression pattern across the two different samples. The blue regions in the neuronal population represent the 57.99% of the upregulated genes and the red region represents the downregulated genes. The dendogram on the x-axis shows the grouping of same samples (biological replicates) while the y-axis shows clustering of (genes with) similar expression patterns
Fig. 4
Fig. 4
Gene Ontology (GO) enrichment analysis of the differentially expressed genes in the neuronal cells. GO enrichment analysis was performed using the enriched and the depleted genes from the neuronal cells. Figures illustrate a subset of GO terms common to both the neuronal and non-neuronal population biological properties hierarchies (see Additional files 9 and 18 for complete hierarchies, the interactive hierarchies can be obtained from the BioGRID repository) and a few specific to one or the other hierarchy (a) and (b). The hierarchies of the GO terms are based on the number of genes and the significance for the category biological process (compare to Table 1). The circles/nodes represent the different GO terms, where the size of the circle represent the number of genes associated with the term, i.e., the larger the circles, the more the number of genes associated with the GO term. The color scheme represents the significance: white represents the least, and orange represents the most significant terms. The white, yellow and orange circles represent the terms common to both the neuronal and non-neuronal networks, while the red and blue circumferences of the circles represent terms specific to either the neuronal or non-neuronal data sets respectively. a Core hierarchy of GO terms defining biological processes in enriched genes comprising the ‘neuronal’ gene set. 530 genes are included in this analysis. b. Core hierarchy of GO terms defining biological processes in the depleted genes comprising the ‘non-neuronal’ gene set. 482 genes are included in this analysis. The green and pink boxes highlight examples of sub hierarchies within the larger hierarchies of biological process GO terms common to both populations but differentially enriched between the two. Sub-hierarchies of biological process GO terms are significantly enriched in the neuronal population, ‘ion transport’ and ‘nervous system development’ but not in the non-neuronal population (shaded pink boxes). Examples of GO term sub-hierarchies enriched in the non-neuronal population include regulation of ‘metabolic and biosynthetic processes’ and ‘organ development’ (shaded green boxes). The corresponding p-values and percentage of genes associated with the GO terms in the green and pink boxes as well as the specific terms in either population are shown in Table 1
Fig. 5
Fig. 5
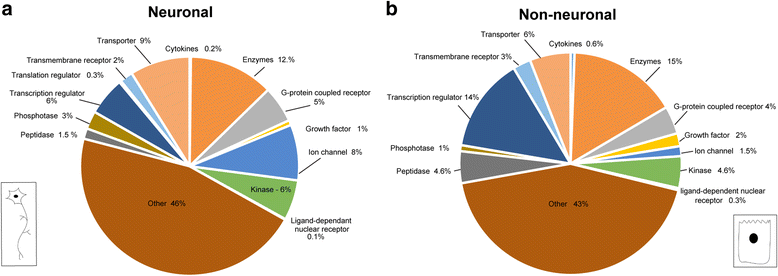
Gene function category enrichment of the significantly differentially expressed genes in the neuronal and non-neuronal gene populations: Pie-chart showing the most functionally enriched terms in the significantly differentially expressed genes IPA analysis. a gene function categories enriched in the neuronal population. b Gene category functions enriched in the non-neuronal population. Different colors represent different molecular functions and the size of the pie slice, the percentage of genes representing this category. Each category represents differentially expressed genes grouped by functional category. For example, ion-channels represent 8% of the DEG in the neuronal population (a) but only 1.5% of the genes in the non-neuronal population (b). The surprisingly high percentage of the genes are listed as ‘other’ because they are not represented within the functional categories defined by the IPA software parameters. Number of genes associated with each category is available in Additional file 22: Table S3
Fig. 6
Fig. 6
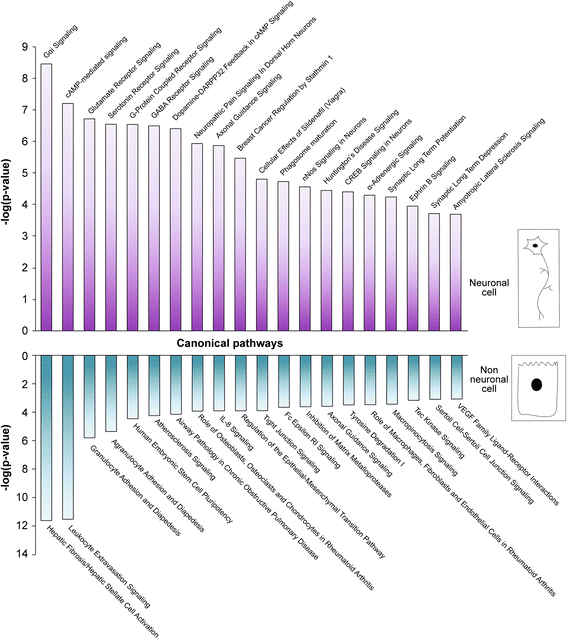
Pathway analysis of the differentially expressed genes in the neuronal and non-neuronal cells of the zebrafish intestine. Pathway analysis of the upregulated, downregulated, and the complete list of significantly differentially expressed genes was done using IPA. The purple bar graph represent the top 20 canonical pathways predicted to be most likely to be activated in the neuronal genes using the genes most significantly enriched in the neuronal population while the blue bar graph represents the top 20 canonical pathways predicted to be most likely to be activated in the neuronal genes using the genes most significantly downregulated in the non-neuronal population

Similar articles

Cited by

References

    1. Heanue TA, Pachnis V. Enteric nervous system development and Hirschsprung's disease: advances in genetic and stem cell studies. Nat Rev Neurosci. 2007;8(6):466–79. doi: 10.1038/nrn2137. - DOI - PubMed
    1. Burns AJ, Pachnis V. Development of the enteric nervous system: bringing together cells, signals and genes. Neurogastroenterol Motil. 2009;21(2):100–2. doi: 10.1111/j.1365-2982.2008.01255.x. - DOI - PubMed
    1. Burns AJ. Migration of neural crest-derived enteric nervous system precursor cells to and within the gastrointestinal tract. Int J Dev Biol. 2005;49(2-3):143–50. doi: 10.1387/ijdb.041935ab. - DOI - PubMed
    1. Furness JB, et al. The enteric nervous system and gastrointestinal innervation: integrated local and central control. Adv Exp Med Biol. 2014;817:39–71. doi: 10.1007/978-1-4939-0897-4_3. - DOI - PubMed
    1. Goldstein AM, Hofstra RM, Burns AJ. Building a brain in the gut: development of the enteric nervous system. Clin Genet. 2013;83(4):307–16. doi: 10.1111/cge.12054. - DOI - PMC - PubMed

Publication types

LinkOut - more resources