

Gait characterization in golden retriever muscular dystrophy dogs using linear discriminant analysis
- PMID: 28403854
- PMCID: PMC5388997
- DOI: 10.1186/s12891-017-1494-4
Gait characterization in golden retriever muscular dystrophy dogs using linear discriminant analysis
Abstract
Background: Accelerometric analysis of gait abnormalities in golden retriever muscular dystrophy (GRMD) dogs is of limited sensitivity, and produces highly complex data. The use of discriminant analysis may enable simpler and more sensitive evaluation of treatment benefits in this important preclinical model.
Methods: Accelerometry was performed twice monthly between the ages of 2 and 12 months on 8 healthy and 20 GRMD dogs. Seven accelerometric parameters were analysed using linear discriminant analysis (LDA). Manipulation of the dependent and independent variables produced three distinct models. The ability of each model to detect gait alterations and their pattern change with age was tested using a leave-one-out cross-validation approach.
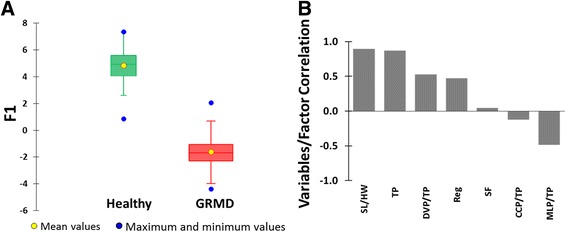
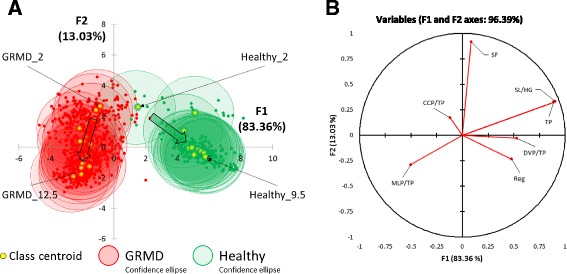
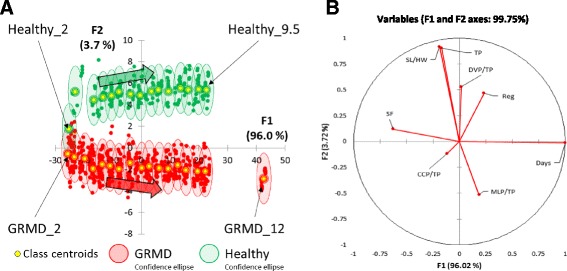
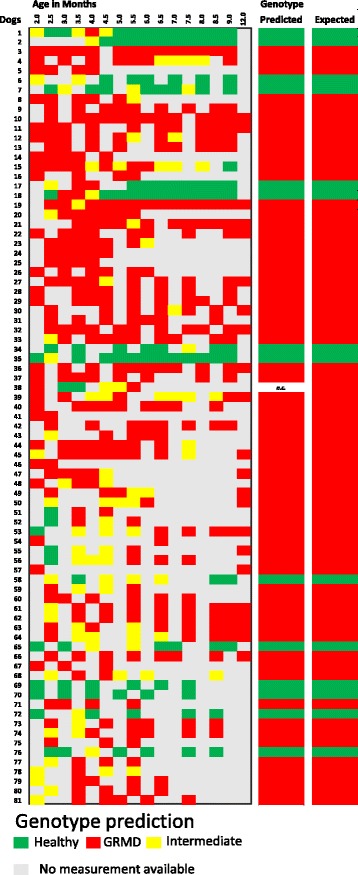
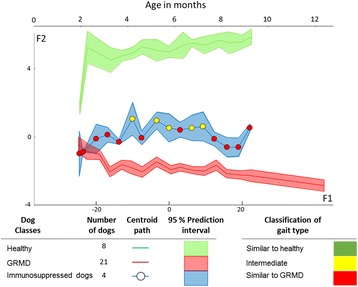
Results: Selecting genotype (healthy or GRMD) as the dependent variable resulted in a model (Model 1) allowing a good discrimination between the gait phenotype of GRMD and healthy dogs. However, this model was not sufficiently representative of the disease progression. In Model 2, age in months was added as a supplementary dependent variable (GRMD_2 to GRMD_12 and Healthy_2 to Healthy_9.5), resulting in a high overall misclassification rate (83.2%). To improve accuracy, a third model (Model 3) was created in which age was also included as an explanatory variable. This resulted in an overall misclassification rate lower than 12%. Model 3 was evaluated using blinded data pertaining to 81 healthy and GRMD dogs. In all but one case, the model correctly matched gait phenotype to the actual genotype. Finally, we used Model 3 to reanalyse data from a previous study regarding the effects of immunosuppressive treatments on muscular dystrophy in GRMD dogs. Our model identified significant effect of immunosuppressive treatments on gait quality, corroborating the original findings, with the added advantages of direct statistical analysis with greater sensitivity and more comprehensible data representation.
Conclusions: Gait analysis using LDA allows for improved analysis of accelerometry data by applying a decision-making analysis approach to the evaluation of preclinical treatment benefits in GRMD dogs.
Keywords: Accelerometry; Animal model; Discriminant analysis; GRMD; Gait assessment; Muscular dystrophy; Treatment evaluation.
Figures
Similar articles
-
Effects of an immunosuppressive treatment in the GRMD dog model of Duchenne muscular dystrophy.PLoS One. 2012;7(11):e48478. doi: 10.1371/journal.pone.0048478. Epub 2012 Nov 21. PLoS One. 2012. PMID: 23185260 Free PMC article.
-
Gait analysis using accelerometry in dystrophin-deficient dogs.Neuromuscul Disord. 2009 Nov;19(11):788-96. doi: 10.1016/j.nmd.2009.07.014. Epub 2009 Oct 1. Neuromuscul Disord. 2009. PMID: 19800232
-
The golden retriever model of Duchenne muscular dystrophy.Skelet Muscle. 2017 May 19;7(1):9. doi: 10.1186/s13395-017-0124-z. Skelet Muscle. 2017. PMID: 28526070 Free PMC article. Review.
-
Expiratory dysfunction in young dogs with golden retriever muscular dystrophy.Neuromuscul Disord. 2020 Nov;30(11):930-937. doi: 10.1016/j.nmd.2020.09.027. Epub 2020 Sep 20. Neuromuscul Disord. 2020. PMID: 33071066 Free PMC article.
-
Canine models of Duchenne muscular dystrophy and their use in therapeutic strategies.Mamm Genome. 2012 Feb;23(1-2):85-108. doi: 10.1007/s00335-011-9382-y. Epub 2012 Jan 5. Mamm Genome. 2012. PMID: 22218699 Free PMC article. Review.
Cited by
-
Four-limb wireless IMU sensor system for automatic gait detection in canines.Sci Rep. 2022 Mar 21;12(1):4788. doi: 10.1038/s41598-022-08676-1. Sci Rep. 2022. PMID: 35314731 Free PMC article.
-
The Dog Model in the Spotlight: Legacy of a Trustful Cooperation.J Neuromuscul Dis. 2019;6(4):421-451. doi: 10.3233/JND-190394. J Neuromuscul Dis. 2019. PMID: 31450509 Free PMC article.
-
Long-term microdystrophin gene therapy is effective in a canine model of Duchenne muscular dystrophy.Nat Commun. 2017 Jul 25;8:16105. doi: 10.1038/ncomms16105. Nat Commun. 2017. PMID: 28742067 Free PMC article.
-
Gait Characterization in Duchenne Muscular Dystrophy (DMD) Using a Single-Sensor Accelerometer: Classical Machine Learning and Deep Learning Approaches.Sensors (Basel). 2024 Feb 8;24(4):1123. doi: 10.3390/s24041123. Sensors (Basel). 2024. PMID: 38400281 Free PMC article.
References
Publication types
MeSH terms
Substances
LinkOut - more resources
Full Text Sources
Other Literature Sources
