. 2017 Apr 12;18(1):69.
doi: 10.1186/s13059-017-1197-z.

H2A monoubiquitination in Arabidopsis thaliana is generally independent of LHP1 and PRC2 activity

Affiliations

H2A monoubiquitination in Arabidopsis thaliana is generally independent of LHP1 and PRC2 activity

Yue Zhou et al. Genome Biol. .

Abstract

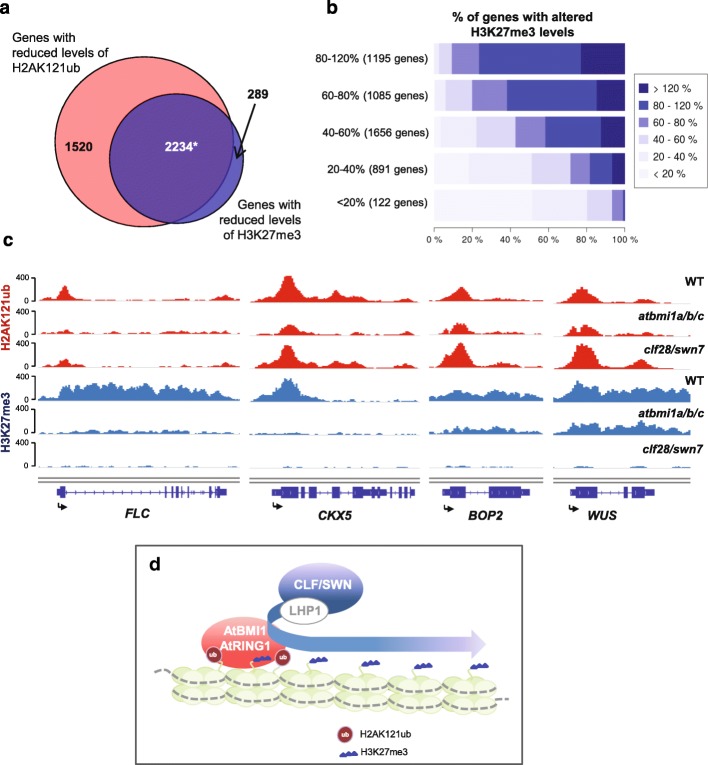
Background: Polycomb group complexes PRC1 and PRC2 repress gene expression at the chromatin level in eukaryotes. The classic recruitment model of Polycomb group complexes in which PRC2-mediated H3K27 trimethylation recruits PRC1 for H2A monoubiquitination was recently challenged by data showing that PRC1 activity can also recruit PRC2. However, the prevalence of these two mechanisms is unknown, especially in plants as H2AK121ub marks were examined at only a handful of Polycomb group targets.

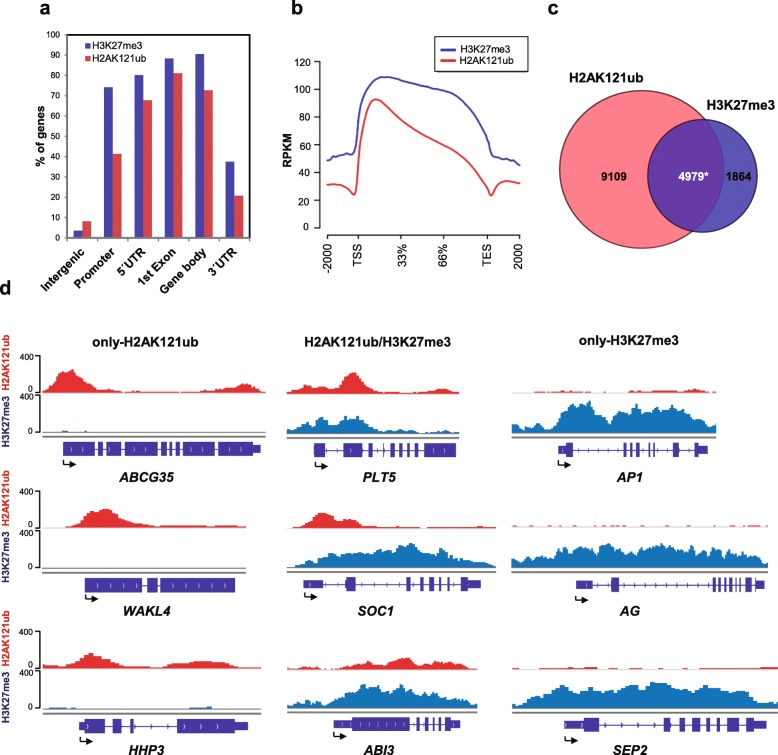
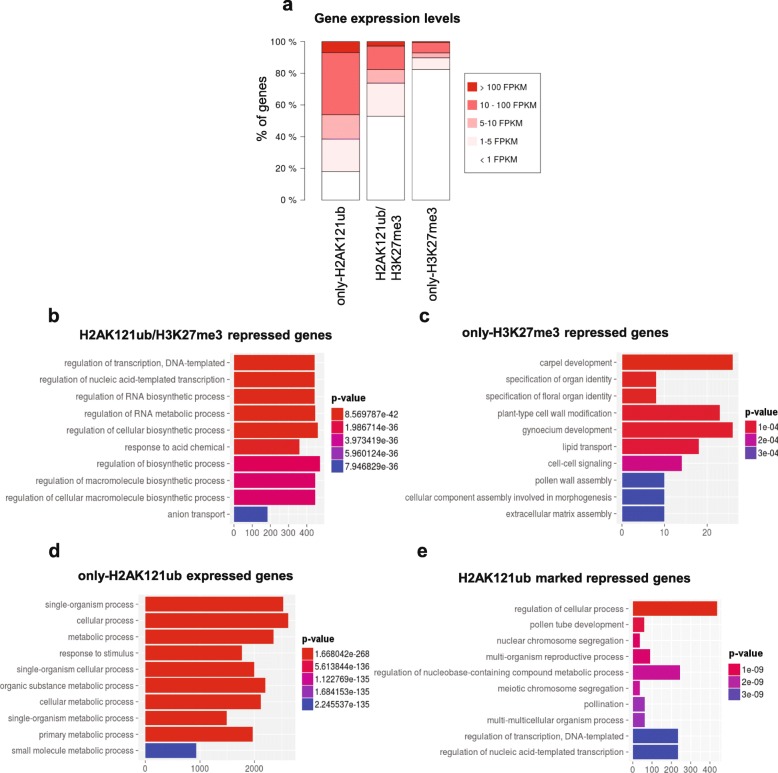
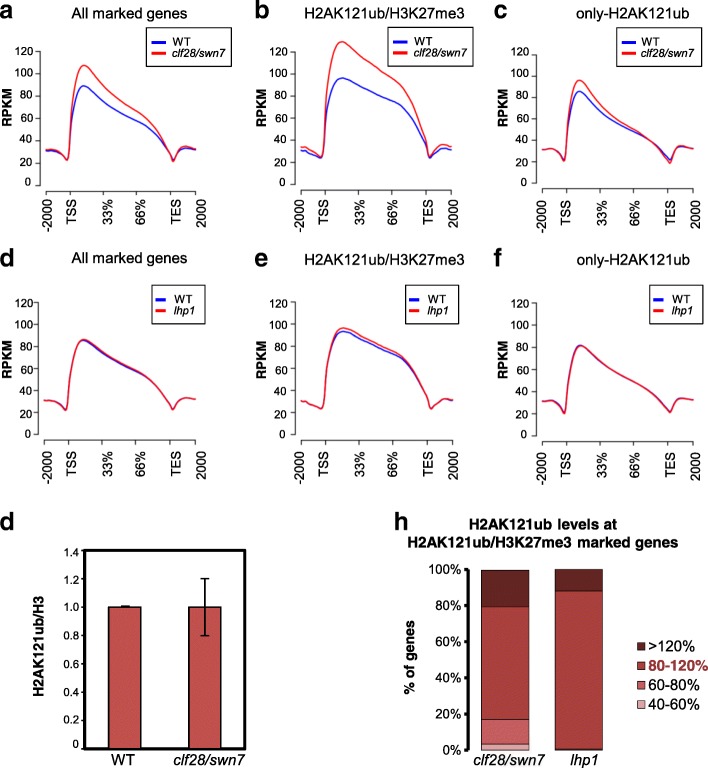
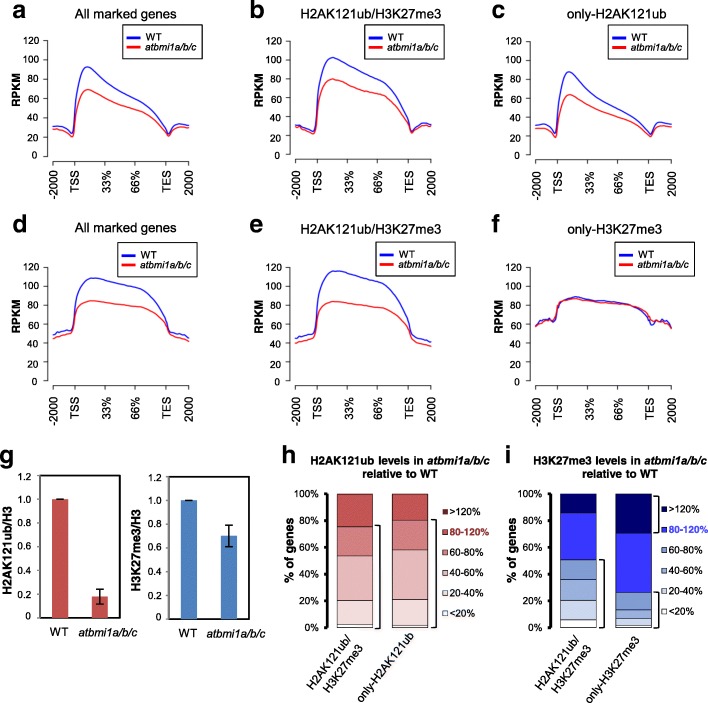
Results: By using genome-wide analyses, we show that H2AK121ub marks are surprisingly widespread in Arabidopsis thaliana, often co-localizing with H3K27me3 but also occupying a set of transcriptionally active genes devoid of H3K27me3. Furthermore, by profiling H2AK121ub and H3K27me3 marks in atbmi1a/b/c, clf/swn, and lhp1 mutants we found that PRC2 activity is not required for H2AK121ub marking at most genes. In contrast, loss of AtBMI1 function impacts the incorporation of H3K27me3 marks at most Polycomb group targets.

Conclusions: Our findings show the relationship between H2AK121ub and H3K27me3 marks across the A. thaliana genome and unveil that ubiquitination by PRC1 is largely independent of PRC2 activity in plants, while the inverse is true for H3K27 trimethylation.

Keywords: Arabidopsis thaliana; H2AK121ub; H3K27me3; PRC1; PRC2; Polycomb group repression mechanism.


Figures

Fig. 1
Fig. 1
Genome-wide occupancy of H2AK121ub and H3K27me3 marks in A. thaliana. a Percentage of genes showing H2AK121ub and H3K27me3 peaks at annotated genic and intergenic regions in the A. thaliana genome. b Metagene plots of H2AK121ub and H3K27me3 coverage at target genes. TES transcription end site, TSS transcription start site. c Overlap between H2AK121ub- and H3K27me3-marked genes in WT at 7 DAG. Asterisk indicates significant overlap with p value <2.2 × 10−16 and odds ratio 1.74 according to Fisher’s exact test. d ChIP-seq genome browser views of H2AK121ub and H3K27me3 occupancy at selected genes. Gene structures and names are shown underneath each panel. Arrows indicate TSSs
Fig. 2
Fig. 2
Expression levels of differentially marked genes in A. thaliana WT seedlings at 7 DAG. a Percentage of genes belonging to different expression level categories for only-H2AK121ub-, H2AK121ub/H3K27me3-, and only-H3K27me3-marked genes. Expression levels are indicated in fragments per kilobase of exon per million fragments mapped (FPKM). b Gene ontology (GO) enrichment analysis of H2AK121ub/H3K27me3-repressed genes (below 5 FPKM). c GO enrichment analysis of only-H3K27me3-repressed genes. d GO enrichment analysis of only-H2AK121ub-marked expressed genes (at least 5 FPKM). e GO enrichment analysis of onlyH2AK121ub-repressed genes. Distribution of enriched GO terms into the different “biological process” categories as defined by TAIR. P values are indicated by color, the number of genes per category is indicated on the x-axes for be
Fig. 3
Fig. 3
H3K27me3 marks and LHP1 are dispensable for H2AK121ub marking in A. thaliana. ac Metagene plot showing H2AK121ub coverage at a all marked genes, b H2AK121ub/H2AK121ub/H3K27me3-marked genes,and c only-H2AK121ub-marked genes in WT and clf28/swn7 mutants. df Metagene plot showing H2AK121ub coverage at d all marked genes, e H2AK121ub/H2AK121ub/H3K27me3-marked genes, and f only-H2AK121ub-marked genes in WT and lhp1 mutants. g Western blot quantification of H2AK121ub levels normalized to H3 levels in clf28/swn7. Error bars represent standard deviation among at least three biological replicates (see also Additional file 1: Figure S9). h Levels of H2AK121ub marks at H2AK121ub/H3K27me3-marked genes in clf28/swn7 and lhp1 mutants compared to WT. Percentage of genes with different levels of the marks is indicated by the shade of red (80–120% is considered WT levels)
Fig. 4
Fig. 4
H2AK121ub and H3K27me3 marks are reduced in atbmi1a/b/c mutants. ac Metagene plot showing H2AK121ub coverage at a all marked genes, b H2AK121ub/H3K27me3-marked genes, and c only-H2AK121ub-marked genes in WT and atbmi1a/b/c mutants. df Metagene plot showing H3K27me3 coverage at d all marked genes, e H2AK121ub/H3K27me3-marked genes, and f only-H3K27me3-marked genes in WT and atbmi1a/b/c mutants. g WB quantification of H2AK121ub and H3K27me3 levels normalized to H3 levels in WT and atbmi1a/b/c. Error bars represent standard deviation among at least three biological replicates (see also Additional file 1: Figures S13 and S18). h, i Percentage of genes retaining different levels of h H2AK121ub and i H3K27me3 marks at peaks in atbmi1a/b/c mutants. H2AK121ub levels are indicated by the shade of red and H3K27me3 levels by the shade of blue (80–120% is considered WT levels)
Fig. 5
Fig. 5
Levels of H3K27me3 and H2AK121ub marks are correlated. a Overlap between genes with reduced levels of H2AK121ub and H3K27me3 marks in atbmi1a/b/c mutants (<80% of WT levels). Asterisk indicates significant overlap with p value <2.2 × 10−16 and odds ratio of 7.95 according to Fisher’s exact test. b Correlation of H2AK121ub and H3K27me3 levels in atbmi1a/b/c mutants. H2AK121ub-marked genes were partitioned to consecutive categories ranked by the percentage of H2AK121ub marks at peaks in mutants compared to WT (category on the y-axis). The number of genes in each category is indicated. The x-axis indicates the percentage of genes displaying different changes in H3K27me3 marks. Categories for change in H3K27me3 levels are indicated by the shade of blue. c ChIP-seq genome browser views of H2AK121ub and H3K27me3 levels at different genes in WT, atbmi1a/b/c, and clf28/swn7 mutants. Gene structures and names are shown underneath each panel. Arrows indicate transcription start sites. d Proposed model for a requirement of PRC1 activity to establish H3K27me3 marks at H2AK121ub/H3K27me3 marked genes. Although LHP1 interacts with PRC1, its function is not required for H2AK121 monoubiquitination

Similar articles

Cited by

References

    1. Xiao J, Wagner D. Polycomb repression in the regulation of growth and development in Arabidopsis. Curr Opin Plant Biol. 2015;23:15–24. doi: 10.1016/j.pbi.2014.10.003. - DOI - PubMed
    1. Ringrose L, Paro R. Epigenetic regulation of cellular memory by the Polycomb and Trithorax group proteins. Annu Rev Genet. 2004;38:413–43. doi: 10.1146/annurev.genet.38.072902.091907. - DOI - PubMed
    1. Müller J, Hart CM, Francis NJ, Vargas ML, Sengupta A, Wild B, et al. Histone methyltransferase activity of a Drosophila Polycomb group repressor complex. Cell. 2002;111:197–208. doi: 10.1016/S0092-8674(02)00976-5. - DOI - PubMed
    1. Cao R, Tsukada Y-I, Zhang Y. Role of Bmi-1 and Ring1A in H2A ubiquitylation and Hox gene silencing. Mol Cell. 2005;20:845–54. doi: 10.1016/j.molcel.2005.12.002. - DOI - PubMed
    1. Francis NJ, Kingston RE, Woodcock CL. Chromatin compaction by a polycomb group protein complex. Science. 2004;306:1574–7. doi: 10.1126/science.1100576. - DOI - PubMed

MeSH terms