. 2017 Apr 12;11(1):47.
doi: 10.1186/s12918-017-0420-6.

An additional k-means clustering step improves the biological features of WGCNA gene co-expression networks

Affiliations

An additional k-means clustering step improves the biological features of WGCNA gene co-expression networks

Juan A Botía et al. BMC Syst Biol. .

Abstract

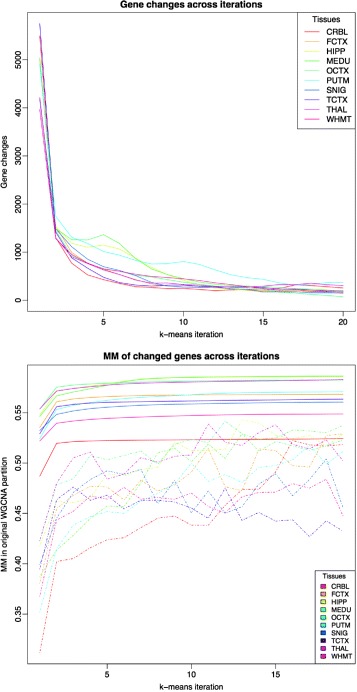
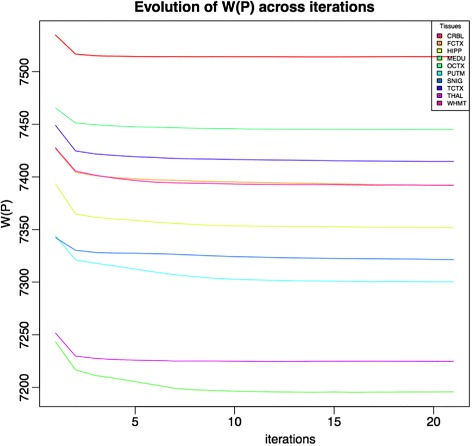
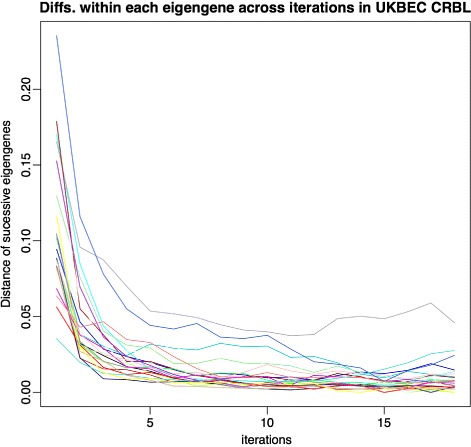
Background: Weighted Gene Co-expression Network Analysis (WGCNA) is a widely used R software package for the generation of gene co-expression networks (GCN). WGCNA generates both a GCN and a derived partitioning of clusters of genes (modules). We propose k-means clustering as an additional processing step to conventional WGCNA, which we have implemented in the R package km2gcn (k-means to gene co-expression network, https://github.com/juanbot/km2gcn ).

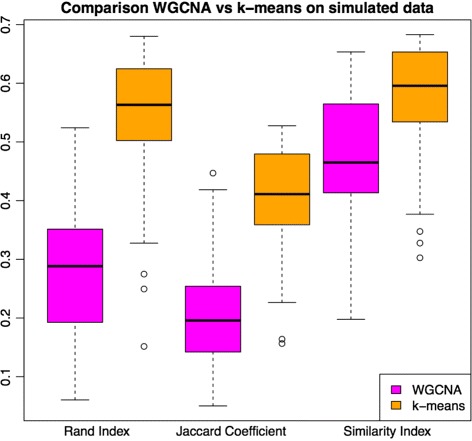
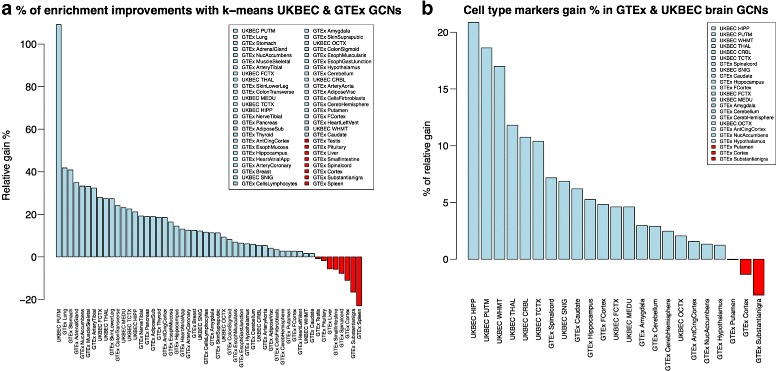
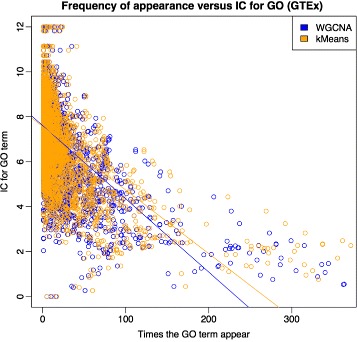
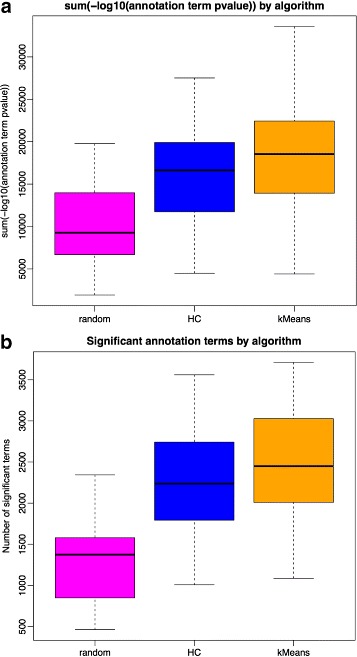
Results: We assessed our method on networks created from UKBEC data (10 different human brain tissues), on networks created from GTEx data (42 human tissues, including 13 brain tissues), and on simulated networks derived from GTEx data. We observed substantially improved module properties, including: (1) few or zero misplaced genes; (2) increased counts of replicable clusters in alternate tissues (x3.1 on average); (3) improved enrichment of Gene Ontology terms (seen in 48/52 GCNs) (4) improved cell type enrichment signals (seen in 21/23 brain GCNs); and (5) more accurate partitions in simulated data according to a range of similarity indices.

Conclusions: The results obtained from our investigations indicate that our k-means method, applied as an adjunct to standard WGCNA, results in better network partitions. These improved partitions enable more fruitful downstream analyses, as gene modules are more biologically meaningful.

Keywords: Assessment of better gene clusters on bulk tissue; Gene co-expression networks on brain; K-means applied to WGCNA.


Figures

Fig. 1
Fig. 1
Upper plot shows the evolution of the number of moved genes (y axis) between any pair of modules p i and p j across k-means iterations (x axis) for UKBEC-microarray dataset. Bottom plot shows the average module membership of genes (y axis) moved (dashed line) across iterations (x axis) for the UKBEC-microarray dataset in comparison with average module membership for all the genes (solid line)
Fig. 2
Fig. 2
The within cluster distance evolution during the k-means runs for the UKBEC datasets
Fig. 3
Fig. 3
Euclidean distance of successive module eigengenes along the k-means iterations for Cerebellum samples for UKBEC datasets
Fig. 4
Fig. 4
Results on performance of standard WGCNA and k-means on 42 simulated data sets that used the GTEx WGCNA GNCs as seed for simulation. We display the same results using three different indexes of similarity between cluster partitions. The k-means method outperforms standard WGCNA with all three indexes used
Fig. 5
Fig. 5
The left plot’s light blue blue bars show the percentage of relative improvement by k-means with respect to WGCNA S GO(P) statistic. Values in red (<0%) are those that k-means fails to improve. The right plot shows cell type enrichment improvement in the same way, for the 10 UKBEC GCNs and the 13 GTEx brain networks. Again, values in red are those that k-means fails to improve
Fig. 6
Fig. 6
Relation between frequency of appearance of GO annotation terms across all GTEx GCNs and IC (information content). Terms appearing more times tend to have lower IC. Regression lines show that k-means gets better IC values for highly repetitive terms (not significant Anova test)
Fig. 7
Fig. 7
Effect of random assignment of genes selected by k-means, on a WGCNA partition, to be changed from one module to another. Plot (a) refers to S GO(P) values and (b) to number of significant terms

Similar articles

Cited by

References

    1. Carpenter AE, Sabatini DM. Systematic genome-wide screens of gene function. Nat Rev Genet. 2004;5(1):11–22. doi: 10.1038/nrg1248. - DOI - PubMed
    1. Parikshak NN, Gandal MJ, Geschwind DH. Systems biology and gene networks in neurodevelopmental and neurodegenerative disorders. Nat Rev Genet. 2015;16(8):441–58. doi: 10.1038/nrg3934. - DOI - PMC - PubMed
    1. Mostafavi S, Morris Q. Combining many interaction networks to predict gene function and analyze gene lists. Proteomics. 2012;12(10):1687–1696. doi: 10.1002/pmic.201100607. - DOI - PubMed
    1. Gamazon ER, Wheeler HE, Shah KP, Mozaffari SV, Aquino-Michaels K, Carroll RJ, Eyler AE, Denny JC, Nicolae DL, Cox NJ, Im HK. A gene-based association method for mapping traits using reference transcriptome data. Nat Genet. 2015;47(9):1091–8. doi: 10.1038/ng.3367. - DOI - PMC - PubMed
    1. Langfelder P, Luo R, Oldham MC, Horvath S. Is my network module preserved and reproducible? PLoS Comput Biol. 2011;7(1):1001057. doi: 10.1371/journal.pcbi.1001057. - DOI - PMC - PubMed

Publication types

LinkOut - more resources