. 2017 Aug 1;313(2):F163-F173.
doi: 10.1152/ajprenal.00466.2016. Epub 2017 Apr 12.

Intravital imaging of the kidney in a rat model of salt-sensitive hypertension

Affiliations

Intravital imaging of the kidney in a rat model of salt-sensitive hypertension

Bradley T Endres et al. Am J Physiol Renal Physiol. .

Abstract

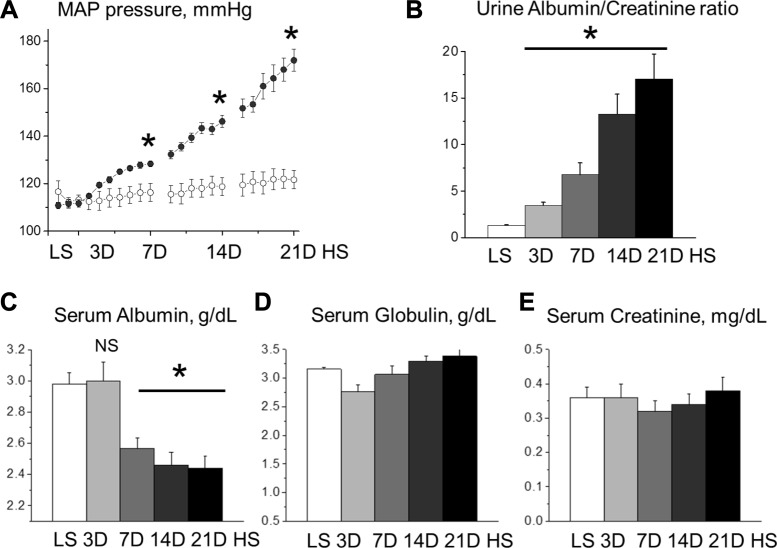
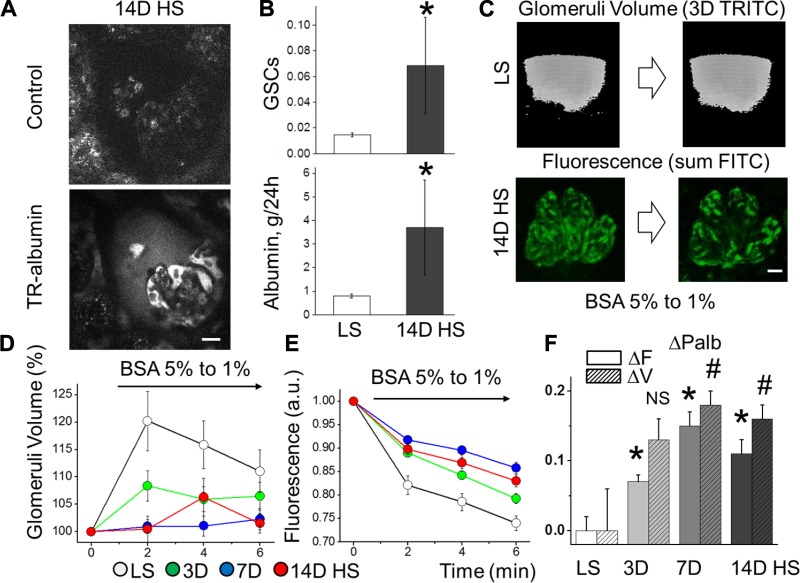
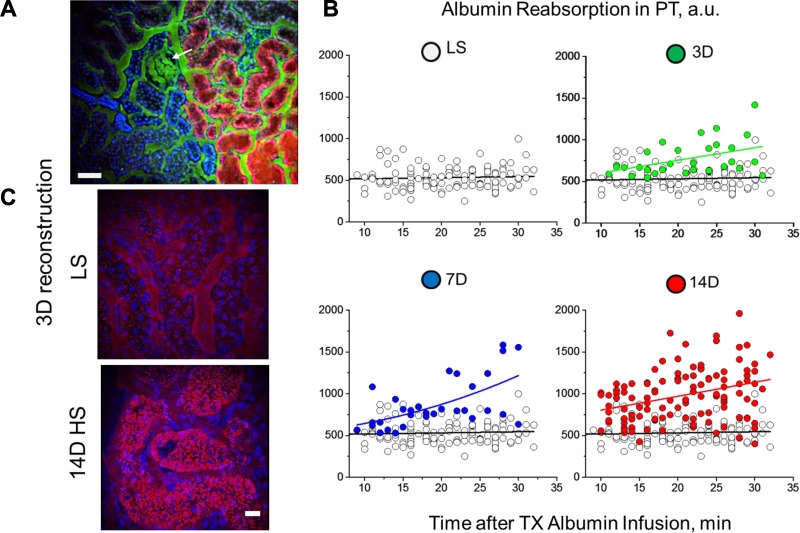
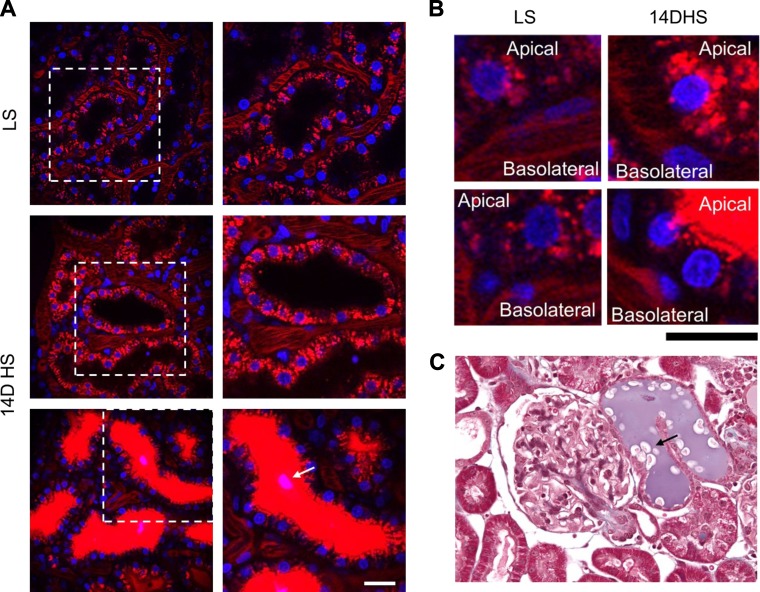
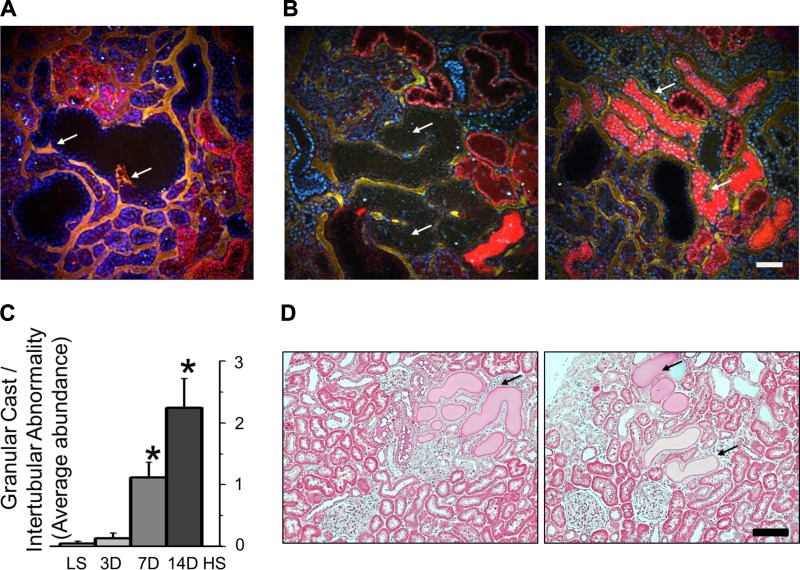
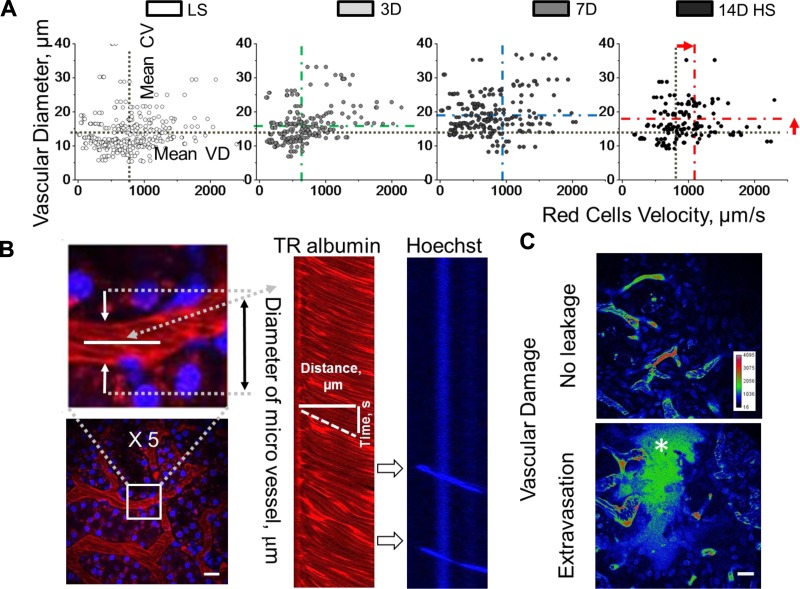
Hypertension is one of the most prevalent diseases worldwide and a major risk factor for renal failure and cardiovascular disease. The role of albuminuria, a common feature of hypertension and robust predictor of cardiorenal disorders, remains incompletely understood. The goal of this study was to investigate the mechanisms leading to albuminuria in the kidney of a rat model of hypertension, the Dahl salt-sensitive (SS) rat. To determine the relative contributions of the glomerulus and proximal tubule (PT) to albuminuria, we applied intravital two-photon-based imaging to investigate the complex renal physiological changes that occur during salt-induced hypertension. Following a high-salt diet, SS rats exhibited elevated blood pressure, increased glomerular sieving of albumin (GSCalb = 0.0686), relative permeability to albumin (+Δ16%), and impaired volume hemodynamics (-Δ14%). Serum albumin but not serum globulins or creatinine concentration was decreased (-0.54 g/dl), which was concomitant with increased filtration of albumin (3.7 vs. 0.8 g/day normal diet). Pathologically, hypertensive animals had significant tubular damage, as indicated by increased prevalence of granular casts, expansion and necrosis of PT epithelial cells (+Δ2.20 score/image), progressive augmentation of red blood cell velocity (+Δ269 µm/s) and micro vessel diameter (+Δ4.3 µm), and increased vascular injury (+Δ0.61 leakage/image). Therefore, development of salt-induced hypertension can be triggered by fast and progressive pathogenic remodeling of PT epithelia, which can be associated with changes in albumin handling. Collectively, these results indicate that both the glomerulus and the PT contribute to albuminuria, and dual treatment of glomerular filtration and albumin reabsorption may represent an effective treatment of salt-sensitive hypertension.

Keywords: albuminuria; chronic kidney disease; glomerulus; proximal tubule.


Figures

Fig. 1.
Fig. 1.
Development of salt-sensitive hypertension in Dahl salt-sensitive (SS) rats. A: mean arterial pressure (MAP) was measured by telemetry in SS rats fed low-salt (LS) followed by high-salt (HS) chow (0.4 vs. 8% NaCl, respectively). B: urine albumin/creatinine ratios demonstrate a rapid development of albuminuria in SS rats fed a HS diet. C: plasma albumin (68 kDa) level in SS rats fed a LS and HS diets, as shown in A. D: concentration of plasma globulins (92–120 kDa) during the development of salt-sensitive hypertension. E: serum creatinine level in SS rats fed LS and HS diet [3 (3D), 7 (7D), 14 (14D), and 21 days (21D)]; n ≥ 7 rats/group for all graphs. *P < 0.05 compared with LS. NS, nonignificant. ○, MAP on the LS diet (NaCl 0.4%); ●, MAPS on HS (NaCl 8%) diets.
Fig. 2.
Fig. 2.
Hypertensive effects on glomerular sieving of albumin (GSCalb) measured in vivo and glomerular permeability to albumin measured ex vivo. A: representative intravital images demonstrating glomerulus before and after infusion of Texas Red (TR)-labeled albumin. These images revealed a significant increase in albumin concentration in the Bowman’s space of SS rats following consumption of a high-salt diet for 14 days (14D HS). Scale bar, 20 µm. B, top: GSCalb assessed with intravital imaging in SS rats fed LS and HS (14 days) diets (n ≥ 5 for each group; *P < 0.05). B, bottom: estimated amount of daily filtered albumin. C: glomeruli were extracted and glomerular permeability studies performed by exposing isolated glomeruli to oncotic gradients (changing BSA from 5 to 1% solution). Fluorescent intensities of FITC albumin and TRITC dextran were monitored by confocal laser scanning. A z-stack of 26 consecutive focal planes (73.83 µm) was collected every 2 min, which allowed for the monitoring of fluorescence within glomerular capillaries (FITC) and surrounding the glomerulus to measure glomerular volume (TRITC) in 3-dimensional reconstruction. D: changes in glomerular volume (% maximum volume change) in SS rats fed a LS vs. 3D, 7D, and 14D on HS; n ≥ 11, P < 0.05. E: fluorescence created by the oncotic gradient following HS consumption (n ≥ 17, P < 0.05). F: changes in permeability to albumin (ΔPalb; n = 11 glomeruli/group) calculated from the volume (ΔV) measurements (hatched bars; #P < 0.05 compared with LS) and fluorescent (ΔF) measurements (solid bars; *P < 0.05 compared with LS).
Fig. 3.
Fig. 3.
Evaluation of proximal tubular reabsorption of albumin during salt-sensitive hypertension. A: 3-dimensional reconstruction of low-magnification screening (IRAPO ×25 W objective, NA 1.0; Leica) shows the glomerulus (arrow), albumin filtered through and actively reabsorbed by proximal tubules (TR-albumin; red), vasculature (150-kDa FITC-labeled dextran; green), and nuclear staining (Hoechst; blue) in proximal and distal (dense blue color) tubules. Scale bar, 100 µm. B: time-dependent changes in TR-albumin (from the initial infusion to >30 min) in proximal tubule (PT) of SS rats fed a LS or HS (3D, 7D, and 14D) diet. Note that PT albumin reabsorption in rats fed a LS diet showed a linear dependence with well-balanced uptake and transcytosis (○). Control reabsorption values are plotted in all of the graphs to demonstrate the differences before and after HS treatment. PT reabsorption increased significantly in a stepwise manner under HS conditions (no. of tubules varies from 30 for 3D and 7D to 110 for LS and 14D groups). C: representative images of PT reabsorbing TR-albumin (28 min after infusion) following consumption of a LS or 14D HS diet (3-dimensional reconstruction of 25 z-stack intravital images). Note the significant increase in TR-albumin (red) reabsorbed by PT under HS diet conditions. Scale bar, 20 µm.
Fig. 4.
Fig. 4.
Reabsorption of albumin by proximal tubule cells and cell damage during salt-sensitive hypertension. A: intarvital imaging of PT after 25 min postinjection of TR-albumin (red) into blood circulation at LS and 14 days of HS. Note the significant accumulation of TR-albumin in PT in the case of substantial glomerular leakage of proteins (bottom). Scale bar, 20 µm. B: high-magnification images of PT and microvascular area under the conditions described in A. Scale bar, 10 µm. Note the high density and different localization of TR-albumin in PT cells at HS conditions. C: representative kidney section from SS rats fed HS diet. Arrow shows protein casts in both intravital (A) and immunohistochemical (C) images of PT.
Fig. 5.
Fig. 5.
Proximal tubule (PT) damage during development of salt-sensitive hypertension and albuminuria. A: 3-dimensional reconstruction of the kidney section from an SS rat fed a HS for 14 days assessed with intravital imaging. Shown are dilated PT (wide black areas) and changes in perivascular beds (arrows; yellow color represents mix of red and green channels, TR-albumin, and 150-kDa FITC-labeled dextran correspondingly). B: low-magnification screening revealed large PT segments with dilated epithelium, granular cast material, and other intertubular abnormalities that resulted in the absence of albumin reabsorption or urine flow. Shown with arrows are cystic-dilated PT (left) and flooding with TR-albumin (right). C: summary graph of PT damage (score of 3 indicates the most severe injury; n = 10 rats/group, with ≤15 images analyzed for each rat; *P < 0.05). D: kidney sections from SS rats fed a HS diet for 14 days. Shown are protein casts and PT tubular damage (arrows). Scale bars, 100 µm for all images.
Fig. 6.
Fig. 6.
Assessing blood flow and vascular pathologies in the kidney. A: cortical renal blood vessel flow rates were evaluated by scanning red blood cell (RBC) velocity. Changes in blood flow and vascular diameter following high salt consumption; n = 339, 225, 225, and 225 vessels for LS, 3D, 7D, and 14D HS, respectively; *P < 0.05 for LS compared with 7D and 14D HS. B: representative images demonstrating the blood vessel line scans used to measure RBC velocity (µm/s) and microvessel diameter (µm). At right is a line scan example that tracks the movement of red blood (red) or white cells (blue) correspondingly. C: vascular extravasation of high-molecular weight molecules was assessed by injecting of 150-kDa FITC-Dextran and scoring the obtained indexed images in the renal cortex of experimental animals (P < 0.05). Top (LS-fed rats): there is no leakage of the 150-kDa Dextran into the interstitial space. Inset: shows the color intensity calibration bar. Bottom (14D HS-fed rats): high-intensity fluorescence within the interstitial space (*) closely matching the plasma intensity. Scale bars, 100 µm for all images.

References

    1. Alani H, Tamimi A, Tamimi N. Cardiovascular co-morbidity in chronic kidney disease: Current knowledge and future research needs. World J Nephrol 3: 156–168, 2014. doi:10.5527/wjn.v3.i4.156. - DOI - PMC - PubMed
    1. Amsellem S, Gburek J, Hamard G, Nielsen R, Willnow TE, Devuyst O, Nexo E, Verroust PJ, Christensen EI, Kozyraki R. Cubilin is essential for albumin reabsorption in the renal proximal tubule. J Am Soc Nephrol 21: 1859–1867, 2010. doi:10.1681/ASN.2010050492. - DOI - PMC - PubMed
    1. Angeli F, Reboldi G, Verdecchia P. Hypertension, inflammation and atrial fibrillation. J Hypertens 32: 480–483, 2014. doi:10.1097/HJH.0000000000000112. - DOI - PubMed
    1. Bakris GL, Kuritzky L. Monitoring and managing urinary albumin excretion: practical advice for primary care clinicians. Postgrad Med 121: 51–60, 2009. doi:10.3810/pgm.2009.07.2031. - DOI - PubMed
    1. Basile DP, Friedrich JL, Spahic J, Knipe N, Mang H, Leonard EC, Changizi-Ashtiyani S, Bacallao RL, Molitoris BA, Sutton TA. Impaired endothelial proliferation and mesenchymal transition contribute to vascular rarefaction following acute kidney injury. Am J Physiol Renal Physiol 300: F721–F733, 2011. doi:10.1152/ajprenal.00546.2010. - DOI - PMC - PubMed

MeSH terms