. 2017 Jun 1;28(11):1519-1529.
doi: 10.1091/mbc.E16-10-0691. Epub 2017 Apr 12.

Scaling of cytoskeletal organization with cell size in Drosophila

Affiliations

Scaling of cytoskeletal organization with cell size in Drosophila

Alison K Spencer et al. Mol Biol Cell. .

Abstract

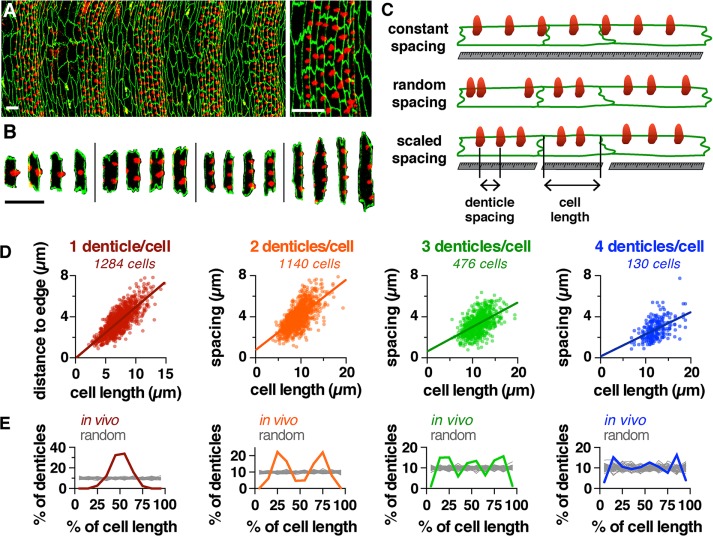
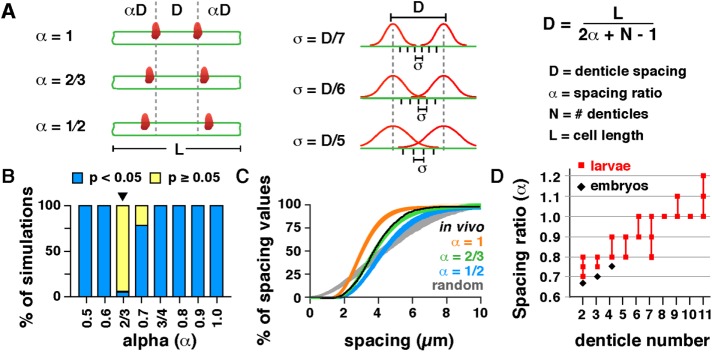
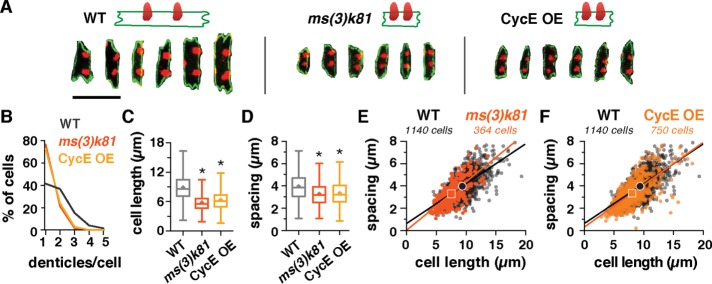
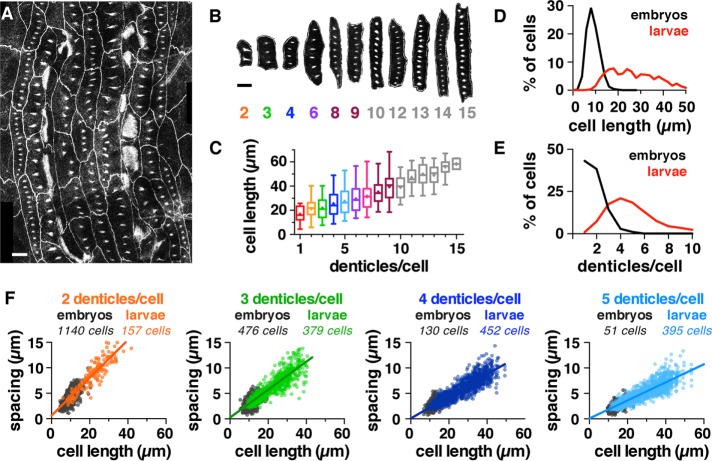
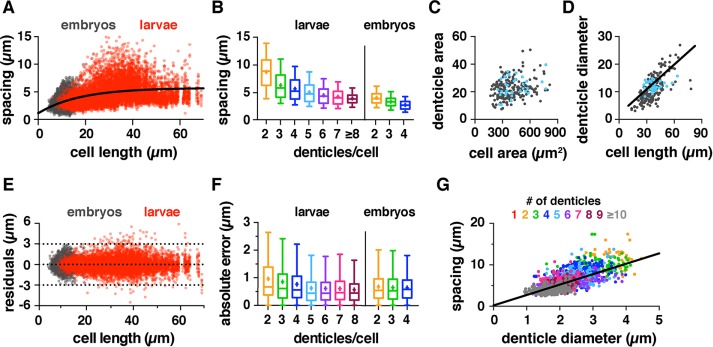
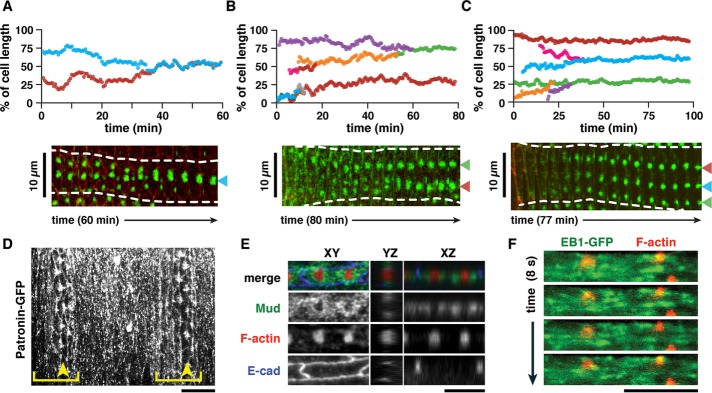
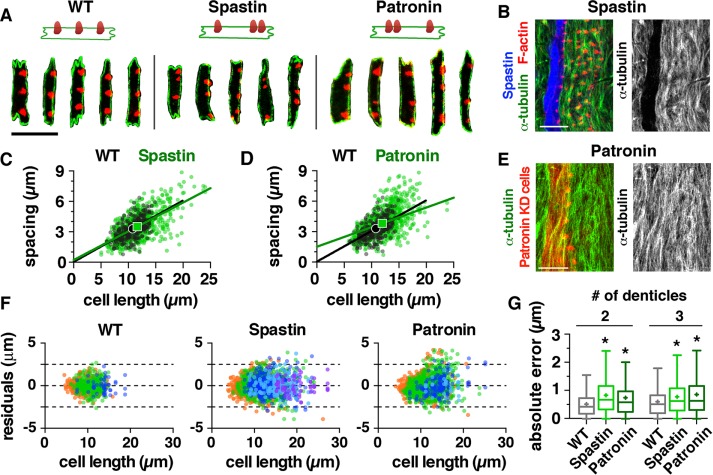
Spatially organized macromolecular complexes are essential for cell and tissue function, but the mechanisms that organize micron-scale structures within cells are not well understood. Microtubule-based structures such as mitotic spindles scale with cell size, but less is known about the scaling of actin structures within cells. Actin-rich denticle precursors cover the ventral surface of the Drosophila embryo and larva and provide templates for cuticular structures involved in larval locomotion. Using quantitative imaging and statistical modeling, we demonstrate that denticle number and spacing scale with cell length over a wide range of cell sizes in embryos and larvae. Denticle number and spacing are reduced under space-limited conditions, and both features robustly scale over a 10-fold increase in cell length during larval growth. We show that the relationship between cell length and denticle spacing can be recapitulated by specific mathematical equations in embryos and larvae and that accurate denticle spacing requires an intact microtubule network and the microtubule minus end-binding protein, Patronin. These results identify a novel mechanism of micro-tubule-dependent actin scaling that maintains precise patterns of actin organization during tissue growth.


Figures

FIGURE 1:
FIGURE 1:
Organization of actin-based denticles in the Drosophila embryo. (A) Denticles localize to the posterior margins of ventral epidermal cells in a regular pattern. Ventral epidermis of a wild-type stage 16 embryo (left), single denticle belt (right). F-actin (phalloidin, red), E-cadherin (green). Ventral views, anterior left. (B) Examples of cells with one to four denticles. Scale bars: 10 µm. (C) Models of denticle organization. (D) Denticle spacing vs. cell length (length of the posterior cell border, parallel to the dorsal–ventral axis) for cells with two to four denticles from embryos at stages 15 and 16. Denticle-to-edge distances plotted for cells with one denticle (distance to the closest dorsal or ventral edge). Lines, best-fit linear regressions. Each dot represents a single denticle–denticle or denticle–edge pair. Data points outside the x- and y-axis ranges (a maximum of 2% of the data points in each plot) are not shown. (E) Denticle positions in vivo (colored lines) were significantly different from uniform random distributions generated by Monte Carlo simulations (gray lines) for cells with one to three denticles (p < 0.05 in 100% of 10,000 Monte Carlo simulations, Kolmogorov-Smirnov test). Cell length was normalized to 100%, 50 simulations/plot shown (n = 130–1,284 cells/denticle class in 12 embryos). See the Supplemental Tables for mean ± SD values (Supplemental Table S1), n values (Supplemental Table S2), best-fit linear regression equations and R2 values (Supplemental Table S3), and Monte Carlo simulations (Supplemental Table S4).
FIGURE 2:
FIGURE 2:
A statistical model recapitulates key features of denticle scaling. (A) Models for denticle spacing (D) varying the spacing ratio (α) and SD (σ). Cell length (L) and denticle number (N) were measured in vivo. (B) Percentage of simulations that were significantly different from (p < 0.05, blue) or consistent with (p ≥ 0.05, yellow) in vivo distributions. Plot varies α for σ = D/6. The α = 2/3, σ = D/6 model (arrowhead) was most similar to the data for wild-type (WT) embryos (p ≥ 0.05 in 94.1% of simulations, Kolmogorov-Smirnov test). (C) Cumulative distribution plot for models varying the spacing ratio (α) for σ = D/6. One thousand simulations are shown for each model. Black line, in vivo measurements for WT embryos. (D) The spacing ratio (α) increases with increasing denticle number in embryos (black) and larvae (red). See the Supplemental Tables for a summary of the modeling outcomes in B and C (Supplemental Table S5) and D (Supplemental Table S6).
FIGURE 3:
FIGURE 3:
Denticle spacing scales with cell length under space-limited conditions in small-cell mutants. (A) Examples of cells with two denticles in wild-type (WT), ms(3)k81 and CycE-OE embryos. F-actin (phalloidin, red), E-cadherin (green). Scale bar: 10 µm. (B) Distribution of cells with one to five denticles in WT, ms(3)k81, and CycE-OE embryos. Cells generate fewer denticles in ms(3)k81 and CycE-OE embryos. (C and D) Cell length (C) and denticle spacing (D) were significantly reduced in ms(3)k81 and CycE-OE embryos compared with WT. Data in D–F shown for cells with two denticles only. Boxes, 25th–75th percentile; whiskers, 1.5 interquartile range (IQR); horizontal line, median; +, mean. *, p < 0.0001 vs. WT, Kruskal-Wallis test with Dunn’s multiple comparison test. (E, F) Denticle spacing vs. cell length for cells with two denticles. Lines, best-fit linear regressions, symbols, means. Data points outside the x- and y-axis ranges (a maximum of 1% of the data points in each plot) are not shown. See the Supplemental Tables for mean ± SD values (Supplemental Table S1), n values (Supplemental Table S2), and best-fit linear regression equations and R2 values (Supplemental Table S3).
FIGURE 4:
FIGURE 4:
Denticle spacing scales over long length scales in larval cells. (A, B) Denticle belt (A) and examples of cells (B) from a first instar wild-type (WT) larva. Denticles were visualized with a marker for F-actin (utrophin-GFP), and cell outlines were visualized with E-cadherin-GFP. Scale bars: 10 µm. (C) Denticle number increases with cell length in larval cells. Boxes, 25th–75th percentile; whiskers, 1.5 interquartile range (IQR); horizontal line, median; +, mean. (D, E) Cell length (D) and number of denticles/cell (E) in WT embryos (black) and larvae (red), n = 3092 cells in 12 embryos, 2150 cells in 18 larvae (p < 0.0001, Kruskal-Wallis test with Dunn’s multiple comparison test). (F) Denticle spacing vs. cell length for cells with two to five denticles. Embryos (gray), larvae (colors). The lines shown are best-fit linear regressions for the larval data. Data points outside the x- and y-axis ranges (a maximum of 1% of the data points in each plot) are not shown. See the Supplemental Tables for mean ± SD values (Supplemental Table S1), n values (Supplemental Table S2), and best-fit linear regression equations and R2 values (Supplemental Table S3).
FIGURE 5:
FIGURE 5:
The accuracy of denticle spacing is maintained in embryos and larvae. (A) Denticle spacing plateaus over long length scales in larvae (red). Gray, data for wild-type (WT) embryos. Best-fit curve to all the data, y = −4.6*e-0.057x + 5.730. (B) Denticle spacing decreases with denticle number. Boxes, 25th–75th percentile; whiskers, 1.5 interquartile range (IQR); horizontal line, median; +, mean. (C) The total summed denticle area is not correlated with cell area. y = 0.01x + 17.2; R2 = 0.06. (D) The total summed denticle diameter correlates with cell length. Best-fit linear regression, y = 0.3x + 1.9; R2 = 0.5. Cells with five denticles are highlighted in blue to show the distribution of a representative cell class. (E) Residuals for the best-fit linear regressions for wild-type embryos (gray) and larvae (red). Dotted lines indicate 3, 0, and −3 μm values. (F) Absolute error of denticle spacing relative to the best-fit linear regressions for wild-type embryos and larvae. The absolute error was slightly increased for cells with two or three denticles in larvae compared with embryos (p < 0.05, Kruskal-Wallis test with Dunn’s multiple comparison test). (G) Denticle spacing increases for larger denticles. Best-fit linear regression (red), y = 2.5x + 0.2; R2 = 0.48. For A, B, E, and F, see Supplemental Table S2 for n values. For C, D, and G, n = 1513 denticles in 223 cells from three larvae. Data points in C and D show summed measurements for all denticles each cell; data points in G show individual measurements for each denticle.
FIGURE 6:
FIGURE 6:
Denticles refine their position as they form and colocalize with microtubule minus end–associated proteins. (A–C) Traces of actin foci during denticle formation (mid- to late stage 14), relative to the total length of the cell (top row) and kymographs (bottom row) of individual denticle cells. Green, utrophin-GFP to label F-actin; red, E-cadherin-Tomato. Each color represents a unique actin focus that has been tracked over time. n = 32 cells analyzed from six embryos. (D) The microtubule minus-end marker Patronin-GFP localizes to sites of denticle formation (stage 15). Brackets, denticle belts; arrowheads, denticle column 5. (E) Mud is enriched in the regions immediately surrounding sites of denticle formation (late stage 14). Green (Mud), red (F-actin), blue (E-cadherin). (F) The microtubule plus-end marker EB1-GFP localizes to dynamic puncta that are distributed throughout the apical cellular domain (late stage 14). Green (EB1-GFP) and red (Moesin-mCherry) expressed in column 1 cells with en-Gal4. Scale bars: 10 µm in A–C; 5 µm in D–F. See also Supplemental Figure S6 and Supplemental Videos S1–S4.
FIGURE 7:
FIGURE 7:
Microtubules are required for denticle organization. (A) Column 1 cells from wild-type (WT), Spastin-overexpressing (Spastin-OE), and Patronin knockdown (Patronin-KD) embryos. F-actin (phalloidin, red), E-cadherin (green). (B) Spastin-GFP overexpression with the en-Gal4 driver depletes microtubules in column 1. Green (α-tubulin), red (F-actin), blue (Spastin-GFP). Scale bar: 10 µm. (C, D) Denticle spacing vs. cell length for column 1 cells with three denticles in WT (black) and Spastin-OE or Patronin-KD (green) embryos. Lines, best-fit linear regressions; symbols, means. Data points outside the x- and y-axis ranges (a maximum of 0.3% of the data points in each plot) are not shown. (E) Expression of a Patronin short hairpin RNA transgene using en-Gal4 does not affect the overall organization of column 1 microtubules. Green (α-tubulin), red (Moesin-mCherry labels en-Gal4-expressing cells). Scale bar: 10 µm. (F) Residuals for the best-fit linear regressions for WT, Spastin-OE, and Patronin-KD. Colors indicate cells with two (orange), three (green), four (dark blue), five (light blue), or six denticles (purple). (G) Absolute error of spacing relative to the best-fit linear regressions. Boxes, 25th–75th percentile; whiskers, 1.5 interquartile range (IQR); horizontal line, median; +, mean. *, p < 0.001 compared with WT, Kruskal-Wallis test with Dunn’s multiple comparison test. See the Supplemental Tables for mean ± SD values (Supplemental Table S1), n values (Supplemental Table S2), and best-fit linear regression equations and R2 values (Supplemental Table S3).

Similar articles

Cited by

References

    1. Alexandre C, Lecourtois M, Vincent JP. Wingless and Hedgehog pattern Drosophila denticle belts by regulating the production of short-range signals. Development. 1999;126:5689–5698. - PubMed
    1. Anderson CA, Eser U, Korndorf T, Borsuk ME, Skotheim JM, Gladfelter AS. Nuclear repulsion enables division autonomy in a single cytoplasm. Curr Biol. 2013;23:1999–2010. - PMC - PubMed
    1. Atwood HL, Govind CK, Wu CF. Differential ultrastructure of synaptic terminals on ventral longitudinal abdominal muscles in Drosophila larvae. J Neurobiol. 1993;24:1008–1024. - PubMed
    1. Bergstralh DT, Haack T, St Johnston D. Epithelial polarity and spindle orientation: intersecting pathways. Philos Trans R Soc B Biol Sci. 2013;368:20130291–20130291. - PMC - PubMed
    1. Bird AW, Hyman AA. Building a spindle of the correct length in human cells requires the interaction between TPX2 and Aurora A. J Cell Biol. 2008;182:289–300. - PMC - PubMed

LinkOut - more resources