. 2017 Jul 1;118(1):496-506.
doi: 10.1152/jn.00927.2016. Epub 2017 Apr 12.

Interaction of compass sensing and object-motion detection in the locust central complex

Affiliations

Interaction of compass sensing and object-motion detection in the locust central complex

Tobias Bockhorst et al. J Neurophysiol. .

Abstract

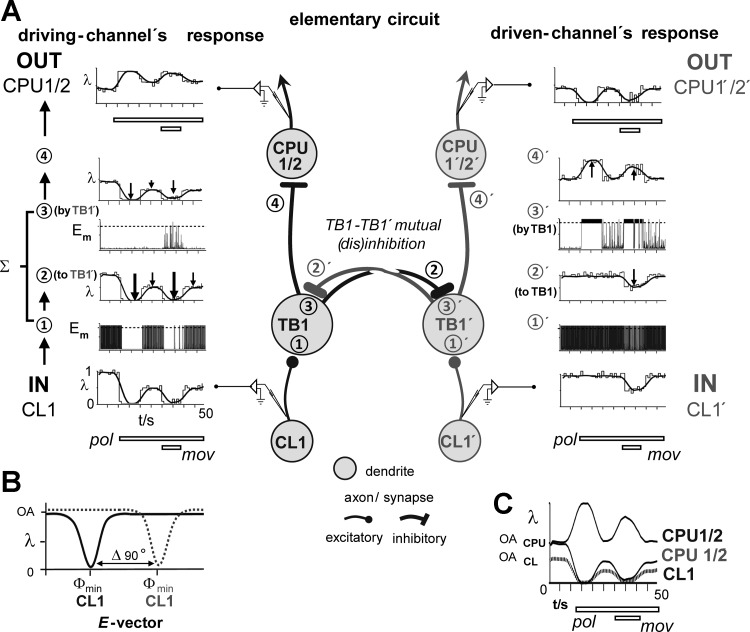
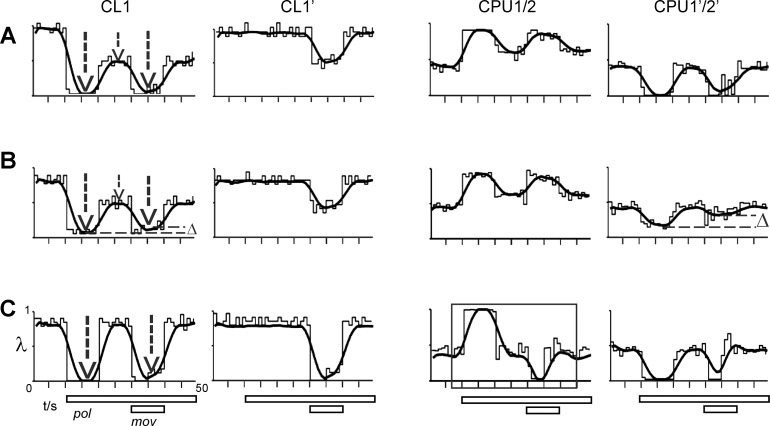
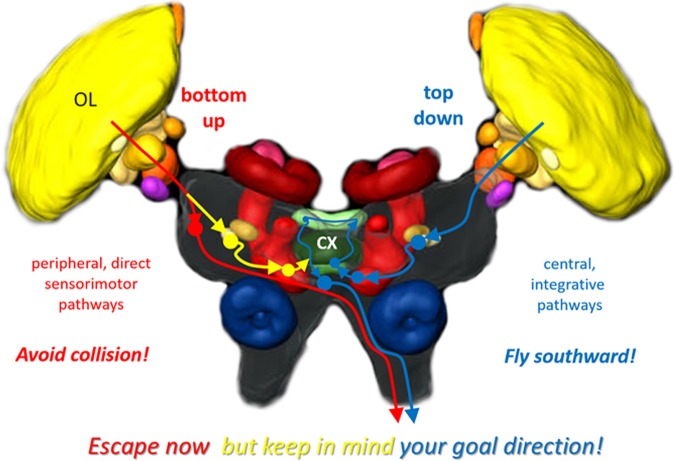
Goal-directed behavior is often complicated by unpredictable events, such as the appearance of a predator during directed locomotion. This situation requires adaptive responses like evasive maneuvers followed by subsequent reorientation and course correction. Here we study the possible neural underpinnings of such a situation in an insect, the desert locust. As in other insects, its sense of spatial orientation strongly relies on the central complex, a group of midline brain neuropils. The central complex houses sky compass cells that signal the polarization plane of skylight and thus indicate the animal's steering direction relative to the sun. Most of these cells additionally respond to small moving objects that drive fast sensory-motor circuits for escape. Here we investigate how the presentation of a moving object influences activity of the neurons during compass signaling. Cells responded in one of two ways: in some neurons, responses to the moving object were simply added to the compass response that had adapted during continuous stimulation by stationary polarized light. By contrast, other neurons disadapted, i.e., regained their full compass response to polarized light, when a moving object was presented. We propose that the latter case could help to prepare for reorientation of the animal after escape. A neuronal network based on central-complex architecture can explain both responses by slight changes in the dynamics and amplitudes of adaptation to polarized light in CL columnar input neurons of the system.NEW & NOTEWORTHY Neurons of the central complex in several insects signal compass directions through sensitivity to the sky polarization pattern. In locusts, these neurons also respond to moving objects. We show here that during polarized-light presentation, responses to moving objects override their compass signaling or restore adapted inhibitory as well as excitatory compass responses. A network model is presented to explain the variations of these responses that likely serve to redirect flight or walking following evasive maneuvers.

Keywords: central complex; context dependency; desert locust; escape behavior; gain modulation; goal conflict; insect brain; neural modeling; sky compass; spatial orientation.


Figures

Fig. 1.
Fig. 1.
Neural substrates of sky-compass sensing in the locust brain. A: polarization pattern of the blue sky. Electric field (E)-vectors (black bars) are arranged tangentially along concentric circles around the sun. The degree of polarization (thickness of bars) is maximal at an angle of 90° from the sun (S). HOR, horizon; Z, zenith. B: visual pathways to the central complex. The polarization-vision pathway to the central complex is shown on the left (red neuropils, blue arrows), and the pathways that might signal events in the visual scenery are on the right (yellow neuropils, magenta arrows). AOTU-UU, AOTU-LU, upper, resp. lower unit of the anterior optic tubercle; CA, calyx of the mushroom body; CBL, CBU, lower, resp. upper division of the central body; LAL, lateral accessory lobe; LBU, MBU, lateral, resp. medial bulb; PB, protocerebral bridge; POTU, posterior optic tubercle; SMP, superior medial protocerebrum. C: the robust relationship between E-vector pattern and solar position may serve to align the direction of locomotion (α) relative to the sun. Preferred E-vector angles (blue arrows) of output cells in the central-complex network vary systematically along the slices of the PB, spanning a range of 360° across the 16 vertical slices (L1-L8, R1-R8). D and E: major types of polarization-sensitive neuron of the central complex (D, frontal views) and their putative wiring pattern (E), based on data from Bockhorst and Homberg (2015a, 2015b). Tangential neurons of the CBL (TL neurons) invade entire layers of the CBL. Tangential TB neurons invade slices within the PB and layers in the POTU. Columnar neurons connect distinct slices of the PB to the CBU (CPU neurons) or CBL (CL neurons) and have additional arborizations in the lateral accessory lobe. CPU neurons are the principal output elements of the network. A is courtesy of Dr. Keram Pfeiffer, illustrated similarly by Rossel and Wehner (1987); B is modified from Pfeiffer and Homberg (2014); and D is modified from el Jundi et al. (2010), Heinze and Homberg (2007), and Bockhorst and Homberg (2015b).
Fig. 2.
Fig. 2.
Experimental procedure and data analysis. A: experimental setup for presentation of virtual moving objects and polarized light during intracellular recording. For compass stimulation, blue light emitted from an LED in the zenith was directed through a rotatable linear polarizer onto the locust’s eyes. Blue arrows indicate electric field vectors. A virtual object (black square) in translatory motion (red arrow) was presented on a cathode ray tube display (CRT) in the left antero-lateral visual field. B: the stimulus paradigm included 3 scenarios in succession: 1) rotation of the polarizer, which mimics yaw-movements for alignment relative to the sun, was used to characterize neuronal tuning to E-vectors; 2) stimulation by stationary polarizer as occurring during constant alignment of the body axis relative to the sun; and 3) the combination of scenario 2 with presentations of a moving object. This combined stimulation was applied after responses to the stationary polarizer (scenario 2) had declined to a tonic plateau. C: for evaluation of spiking activity, different analysis windows (5-s duration) were set to capture the phasic response to the stationary E-vector angle (phasic pol), its tonic plateau level (reference), and the response to combined stimulation (pol and mov), respectively. Black vertical arrow (stop) indicates the stop of polarizer rotation and thus the beginning of scenario 2 (stimulation with a stationary E-vector); the 2 thick horizontal bars indicate occurrence of the moving object stimulus. Spiking activity is an example trace recorded from a CPU2 cell. Bars = 10 mV, 1 s.
Fig. 3.
Fig. 3.
Spiking activity under uni- and bimodal stimulation. Recording traces (A) and rasterplots (B) show representative examples of responses to moving-object stimuli alone (mov/thick horizontal lines). Asterisks mark stimuli that evoked strong (large asterisk) or moderate (small asterisk) responses. C: the corresponding Gaussian-smoothed peristimulus time histograms illustrate how the same respective cell responded to a stationary polarizer (stat pol only) after precedent polarizer rotation stopped (vertical arrow) at an excitatory (Φmax, blue line), neutral (Φneut, black line), or inhibitory E-vector (Φmin, red line). Response to rotation is shown for the TL2 cell only (row 1); λ: firing rate (spikes/s). While some of the polarized-light responses decline to a rate close to the average prestimulus activity (thin horizontal dashed line), others stabilize at a residual plateau (excitatory responses of the TL2 cell and the excitatory responses of TB1 and CPU1 in rows 3 and 4). Occasionally, both cases seem to occur in the same cell (TB1, row 3). In contrast, the activity of the CL1 cell (row 2) following stop of polarizer rotation is marked by slow changes in firing rate both at the inhibitory and neutral E-vector. After stabilization of neural activity the moving object was presented while the presentation of stationary polarized light continued (pol and mov; thick black horizontal bars). With respect to moving object stimuli TL2 and CL1 cells behaved rather stereotypically, with no responsiveness to moving objects alone and combined stimulation in TL2 and a generalized inhibitory response to both scenarios involving the moving object in CL1. By contrast, two different response behaviors were observed in TB1 cells. TB1 cells responsive to the moving object alone (A, row 3, large asterisk) responded stereotypically, i.e., E-vector independently and in the same manner under combined stimulation (C, pol and mov). In TB1 cells unresponsive to the moving object alone (row 4), the combined stimulation triggered a regain of full compass responses, bringing back the unadapted levels of inhibitory or excitatory E-vector responses. The same dichotomy was observed in CPU cells. CPU1/2 neurons that were inhibited during object movement alone (row 5, A and B) maintained inhibitory responses during combined polarizer/moving object stimulation as illustrated for a CPU1 neuron in C. CPU1/2 neurons unresponsive to the moving object alone, however, showed disadaptation of the compass responses when stimulated with a moving object during concurrent presentation of the stationary polarizer as illustrated for a CPU2 neuron (row 6).
Fig. 4.
Fig. 4.
Correlation between the amplitudes of the nonadapted initial compass response and the response during combined E-vector/moving object stimulation in 5 gain-modulating neurons. A and B show normalized firing rates (λnorm; change from reference rate divided by reference rate; see Fig. 2C) during responses to combined stimulation (pol and mov) plotted against the unadapted compass responses measured right after the stop of polarizer rotation (phasic pol). A: linear regressions show significant (P < 0.05) positive correlation of normalized firing rates in 5 individual neurons. Colors code the different neurons; n = number of trials; R2 = coefficient of determination. B: same data set, but each data point represents 1 trial, measured in the neuron indicated by the plot marker legend below. Larger size symbols indicate 2 and in 1 case 3 identical data points. Dashed line: overall linear regression model; λnorm(pol and mov) = 0.6 λnorm(phasic pol) + 0.09; P ≪ 0.0001; R2 = 0.34.
Fig. 5.
Fig. 5.
A network model explaining all types of response to separate and combined stimulation by compass signals and moving object stimuli. A: the elementary circuit in the center explains how TB1- and CPU1/2 neurons can respond to preferred (Φmax) and antipreferred E-vector angles (Φmin), while CL1 cells of the input stage solely respond at their Φmin (Bockhorst and Homberg 2015a). Two channels tuned to E-vector angles differing by 90° are interconnected through mutual inhibition between the 2 TB1 cells (TB1, TB1′) involved. A 2nd inhibition, situated at the TB1-CPU1/2 and TB1′-CPU1′/2′ connection, explains why preferred E-vectors of CPU1/2 cells and corresponding TB1 cells differ by 90° (Heinze and Homberg 2007). A, left (right): intracellular activity at crucial sites in the driving (driven) channel in terms of spike rate (λ, illustrated as Gaussian-smoothed and conventional peristimulus time histogram) or membrane potential (Em, dashed horizontal line: spike threshold). Data were obtained from a run of the simulation that used the input-activity (IN) shown for the CL1- and CL1′ cell at the bottom and produced the output (OUT) shown for the CPU1/2- and CPU1′/2′ cell at the top. As illustrated in B, the E-vector presented above the animal’s head evokes a maximal inhibitory response in the CL1 cell of the driving channel (left), while its counterpart in the driven channel (right; CL1′) is unresponsive to it, preserving its level of ongoing activity (OA). C: taken together, the circuit mediates the regain of declined E-vector responses under concurrent presentation of a moving object stimulus (mov) as well as contrast enhancement of the compass response to polarized light (pol) itself, in that CPU1/2 and CPU1′/2′ respond in an opponent manner and with a higher absolute change in firing rate because their level of ongoing activity is higher than in CL1 cells (Bockhorst and Homberg 2015a).
Fig. 6.
Fig. 6.
Variations in the responses of CL1 result in 3 different types of downstream-response to combined stimulation by compass and moving object stimuli. Conventions as in Fig. 5; plots of firing rate (λ) vs. time show the response of the CL1 cell in the driving (CL1) and driven (CL1′) channel and the corresponding output responses of the CPU1/2 and CPU1′/2′ cell. CPU1/2 responses are strongly determined by the temporal dynamics of the CL1 responses to polarized light. A: a strong phasic-tonic compass response in CL1 (1st and 2nd vertical arrow) results in an equally strong response to combined stimulation (3rd arrow) as well as in a regain of compass responses in CPU1/2 and CPU1′/2′ (reproduced from Fig. 5). B: a decrease in the tonic CL1 response (compare lengths of vertical arrows) leads to dampening (Δ, horizontal line) of the CL1 response to combined stimulation and of the regain of compass response in the driven CPU1′/2′. This in turn should correspond to a shallower slope of the regression lines in Fig. 4A. C: when the CL1 response to polarized light is purely phasic, inhibitory responses to the moving object occur in both CPU1/2 (box) and CPU1′/2′.
Fig. 7.
Fig. 7.
Working hypothesis on visual pathways for adaptive goal-directed behavior in the locust brain. Pathway in red represents fast routes of sensory-motor transformation that circumvent the central complex (CX) to mediate reflexive escape, such as the LGMD-DCMD system that serves to avoid collision. The blue pathway represents the polarization-vision pathway for sky compass orientation, which involves the central-complex network. This pathway serves to integrate long-term goals in planned locomotion in a top-down fashion, e.g., to ensure southward directed migration in spring. Both pathways eventually descend to metathoracic motor centers. A link between both pathways, shown in yellow, serves to inform the top-down planning system on acute events such as imminent collision that will trigger an escape in the near future. This interconnection between both pathways allows the animal to “escape now, but keep in mind your goal direction” for the subsequent resumption of migration in a particular compass direction. Arrowheads and filled circles symbolize pre- and postsynaptic sites, respectively. OL, optic lobe. Brain scheme modified from el Jundi et al. (2010).

References

    1. Bech M, Homberg U, Pfeiffer K. Receptive fields of locust brain neurons are matched to polarization patterns of the sky. Curr Biol 24: 2124–2129, 2014. doi:10.1016/j.cub.2014.07.045. - DOI - PubMed
    1. Beshel J, Zhong Y. Graded encoding of food odor value in the Drosophila brain. J Neurosci 33: 15693–15704, 2013. doi:10.1523/JNEUROSCI.2605-13.2013. - DOI - PMC - PubMed
    1. Bockhorst T, Homberg U. Amplitude and dynamics of polarization-plane signaling in the central complex of the locust brain. J Neurophysiol 113: 3291–3311, 2015a. doi:10.1152/jn.00742.2014. - DOI - PMC - PubMed
    1. Bockhorst T, Homberg U. Compass cells in the brain of an insect are sensitive to novel events in the visual world. PLoS One 10: e0144501, 2015b. doi:10.1371/journal.pone.0144501. - DOI - PMC - PubMed
    1. Chan RW, Gabbiani F. Collision-avoidance behaviors of minimally restrained flying locusts to looming stimuli. J Exp Biol 216: 641–655, 2013. doi:10.1242/jeb.077453. - DOI - PMC - PubMed

Publication types

LinkOut - more resources