. 2017 Apr 12;9(385):eaai9321.
doi: 10.1126/scitranslmed.aai9321.

Longitudinal peripheral blood transcriptional analysis of a patient with severe Ebola virus disease

Affiliations

Longitudinal peripheral blood transcriptional analysis of a patient with severe Ebola virus disease

John C Kash et al. Sci Transl Med. .

Abstract

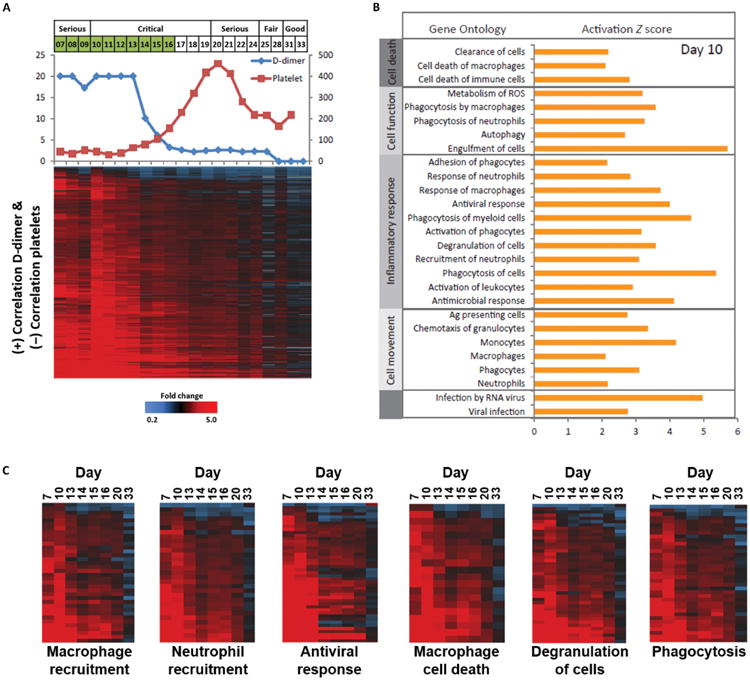
The 2013-2015 outbreak of Ebola virus disease in Guinea, Liberia, and Sierra Leone was unprecedented in the number of documented cases, but there have been few published reports on immune responses in clinical cases and their relationships with the course of illness and severity of Ebola virus disease. Symptoms of Ebola virus disease can include severe headache, myalgia, asthenia, fever, fatigue, diarrhea, vomiting, abdominal pain, and hemorrhage. Although experimental treatments are in development, there are no current U.S. Food and Drug Administration-approved vaccines or therapies. We report a detailed study of host gene expression as measured by microarray in daily peripheral blood samples collected from a patient with severe Ebola virus disease. This individual was provided with supportive care without experimental therapies at the National Institutes of Health Clinical Center from before onset of critical illness to recovery. Pearson analysis of daily gene expression signatures revealed marked gene expression changes in peripheral blood leukocytes that correlated with changes in serum and peripheral blood leukocytes, viral load, antibody responses, coagulopathy, multiple organ dysfunction, and then recovery. This study revealed marked shifts in immune and antiviral responses that preceded changes in medical condition, indicating that clearance of replicating Ebola virus from peripheral blood leukocytes is likely important for systemic viral clearance.


Figures

Fig. 1
Fig. 1. Overall gene expression profile in peripheral blood shows distinct phases during EVD and recovery
(A) Kinetics of EBOV NP mRNA and vRNA in PBLs as measured by strand-specific qRT-PCR during course of illness. Serum EBOV GP RNA qRT-PCR data previously published in (12) are shown for comparison with PBL replication. (B) Heatmap showing expression levels of genes (n = 8660 sequences) that showed ≥2-fold change in expression level in at least 30% of time points relative to a pool of 29 healthy adult volunteers. For all figures, each heatmap column represents gene expression data from a microarray experiment comparing patient peripheral blood at individual time points relative to pooled RNA isolated from peripheral blood from healthy volunteers (n = 29). Genes shown in red were increased, genes shown in blue were decreased, and genes in black indicate no change in expression in EVD patient relative to healthy volunteers. (C) Pairwise Pearson correlation coefficient similarity matrix of expression values of these 8660 sequences. *Previously reported in (12).
Fig. 2
Fig. 2. Gene expression correlating with kinetics of serum EBOV load
(A) Pairwise Pearson correlation coefficient similarity matrix of expression values of transcripts positively correlated (≥0.6) with EBOV GP RNA levels. (B) Heatmap showing overall expression level of genes with positive (n = 2690 sequences) or negative (n = 1071 sequences) correlation with serum Ebola GP RNA (12). (C) Scatterplot showing relative expression of genes at d13/d14. Red points indicate sequences with higher expression on d13 (n = 2350), and blue points indicate sequences with higher expression on d14 (n = 655). (D) Scatterplot showing relative expression of genes at d20 and d21. Red points indicate sequences with higher expression on d20 (n = 550), and blue points indicate sequences with higher expression on d21 (n = 431). (E) Scatterplot showing relative expression of genes at d25/d28. Red points indicate sequences with higher expression on d25 (n = 132), and blue points indicate sequences with higher expression on d28 (n = 1688).
Fig. 3
Fig. 3. Gene expression associated with Ebola viral replication in PBLs
(A) Quantification of EBOV NP mRNA (qPCR Ct) in PBLs and heatmap showing expression of genes with positive correlation (≥0.6) with PBL EBOV NP mRNA. (B) Heatmap showing expression levels of key ISGs. (C) Graph showing relative expression of selected ISGs from (B) as determined by qRT-PCR. (D) Scatterplot showing relative expression of cytokine signaling–related genes (n = 51) at d13/d14. (E) Scatterplot showing relative expression of cell death–related genes (n = 29) at d13 and d14. Red points indicate sequences with higher expression on d13, and blue points indicate sequences with higher expression on d14.
Fig. 4
Fig. 4. Distinct phases of innate antiviral and adaptive immune response markers during EVD
Analysis of inflammation-related gene expression (n = 1029 transcripts) with ≥2-fold change in expression level in at least four individual time points. (A) Pairwise Pearson correlation coefficient similarity matrix of expression values of these transcripts. (B) Heatmap showing expression of innate antiviral and adaptive immune response markers. (C) Total white blood cell (WBC) count and differential analysis of immune cell populations.
Fig. 5
Fig. 5. Strongest induction of inflammatory mediators and receptors generally occurred during early EVD
Heatmaps depicting expression levels of mRNAs encoding chemokines/receptors (A) and cytokines/receptors (B) during EVD and recovery. Gray indicates that the sequence was not detected.
Fig. 6
Fig. 6. Gene expression correlating with clinical parameters of coagulopathy during EVD
(A) Serum D-dimer (μg/ml, left axis) and platelet levels (K/μl, right axis) and heatmap showing expression profiles of transcripts (n = 1016) with expression levels that are correlated positively with serum D-dimer levels (≥.6) and negatively with platelet levels (≤-0.6). (B) Gene ontology analysis of transcripts, with expression levels correlating with serum D-dimer and platelet values (activation Z score is based on d10 expression values). (C) Expression profiles of transcripts involved in macrophage recruitment, neutrophil recruitment, antiviral response, macrophage cell death, degranulation, and phagocytosis.
Fig. 7
Fig. 7. Gene expression correlating with the critical phase of EVD
(A) Serum creatinine values (U/liter, left axis) and EBOV GP levels (qPCR Ct, right axis), with heatmap showing expression profiles of transcripts with positive (≥0.6, n = 576) or negative (≥−0.6, n = 420) correlation with serum creatinine levels. (B) Gene ontology analysis of transcripts, with expression levels correlating with serum creatinine values (activation Z score is based on d15 expression values).
Fig. 8
Fig. 8. Model of patient host responses and clinical disease
PCA-derived model of patient PBL gene expression responses during illness course and recovery. Day of illness is indicated by numbered circles colored by patient medical grade and spatially arranged using Eigen row coordinates. (A) Host defense and immune response markers correlated with peak viral load and clearance of replicating virus from PBL on d7 to d13. (B) Activation of T lymphocytes and switch toward adaptive immune responses associated with appearance of Ebola GP–specific IgG and declining serum EBOV RNA levels on d14 to d15. (C) Continuation of adaptive immune responses and appearance of virus-specific IgGs correlated with decreasing serum EBOV RNA and increased mitogenic and metabolic responses on d16 to d20. (D) Adaptive immune and repair responses associated with appearance of neutralizing antibodies and clearance of serum EBOV RNA on d21 to d24. (E) Similarity of PBL gene expression before patient discharge on d25 to d33 and continuing in outpatient samples on d59 to d270. Timing of clinical symptoms (co-agulopathy, diarrhea, fever, and MOD) is shown as reported in (12).

References

    1. World Health Organization. Ebola Situation Report—30 March 2016. World Health Organization; 2016.
    1. Spengler JR, Ervin ED, Towner JS, Rollin PE, Nichol ST. Perspectives on West Africa Ebola virus disease outbreak, 2013-2016. Emerg Infect Dis. 2016;22:956–963. - PMC - PubMed
    1. Rousgeron V, Feldmann H, Grard G, Becker S, Leroy EM. Ebola and Marburg haemorrhagic fever. J Clin Virol. 2015;64:111–119. - PMC - PubMed
    1. de La Vega MA, Stein D, Kobinger GP. Ebolavirus evolution: Past and present. PLOS Pathog. 2015;11:e1005221. - PMC - PubMed
    1. Rasmussen AL. Host factors in Ebola infection. Annu Rev Genomics Hum Genet. 2016;17:333–351. - PubMed

Publication types