. 2017 Apr 12;9(385):eaak9679.
doi: 10.1126/scitranslmed.aak9679.

Combined antiangiogenic and anti-PD-L1 therapy stimulates tumor immunity through HEV formation

Affiliations

Combined antiangiogenic and anti-PD-L1 therapy stimulates tumor immunity through HEV formation

Elizabeth Allen et al. Sci Transl Med. .

Abstract

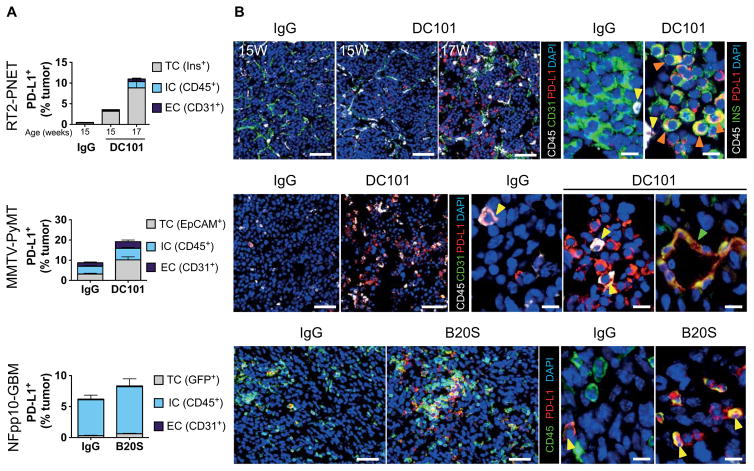
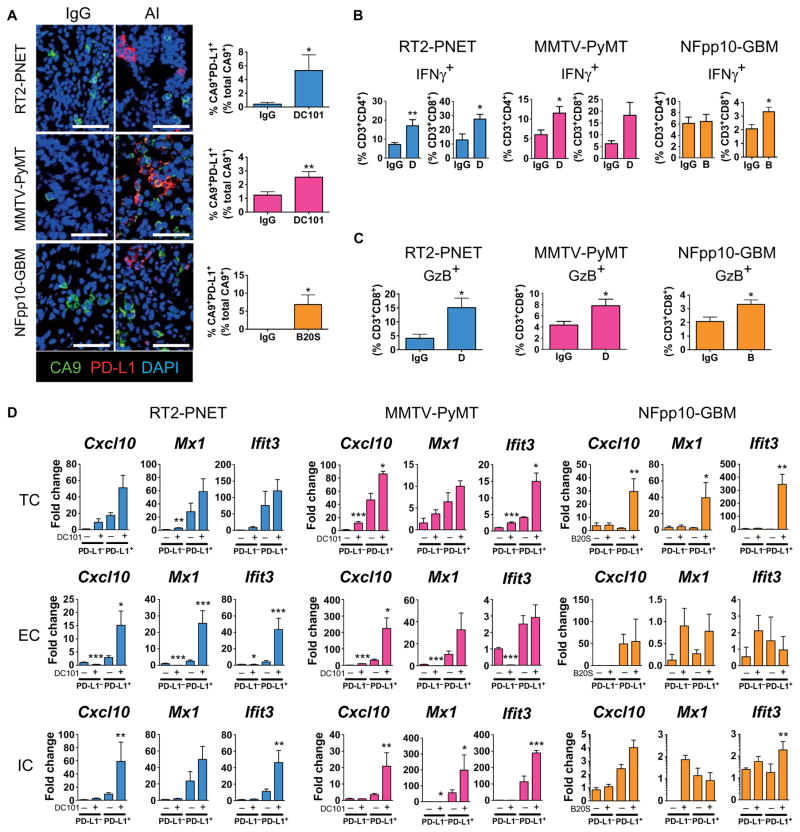
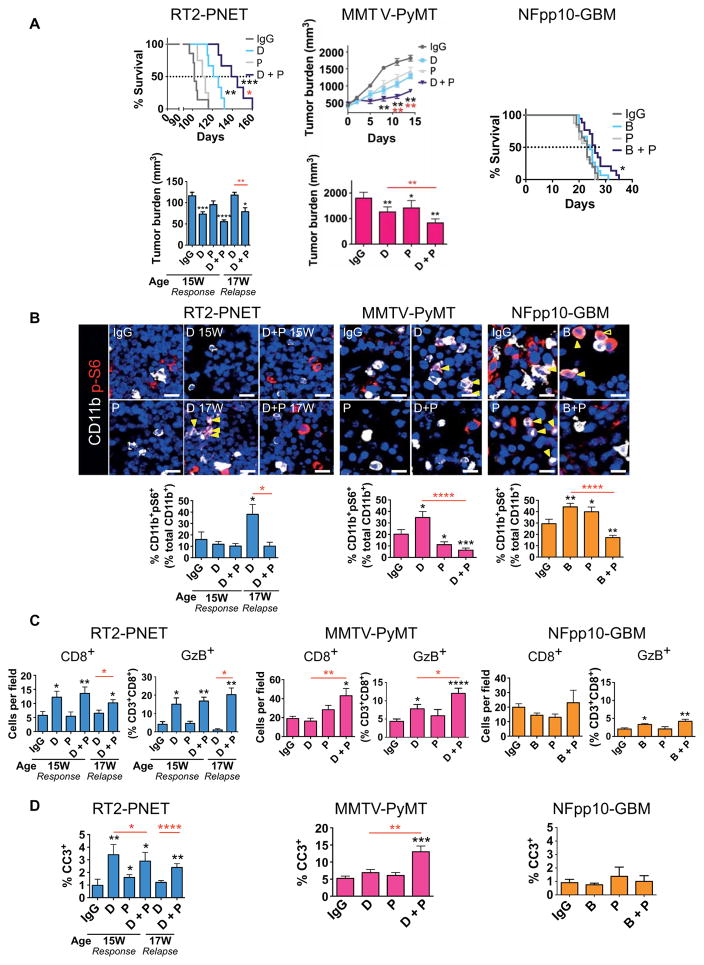
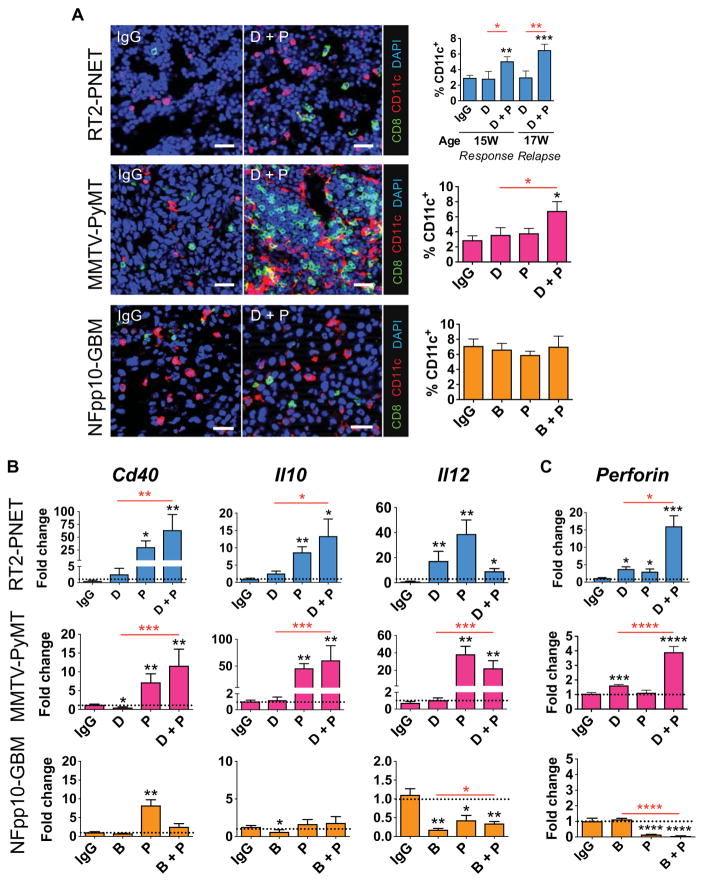
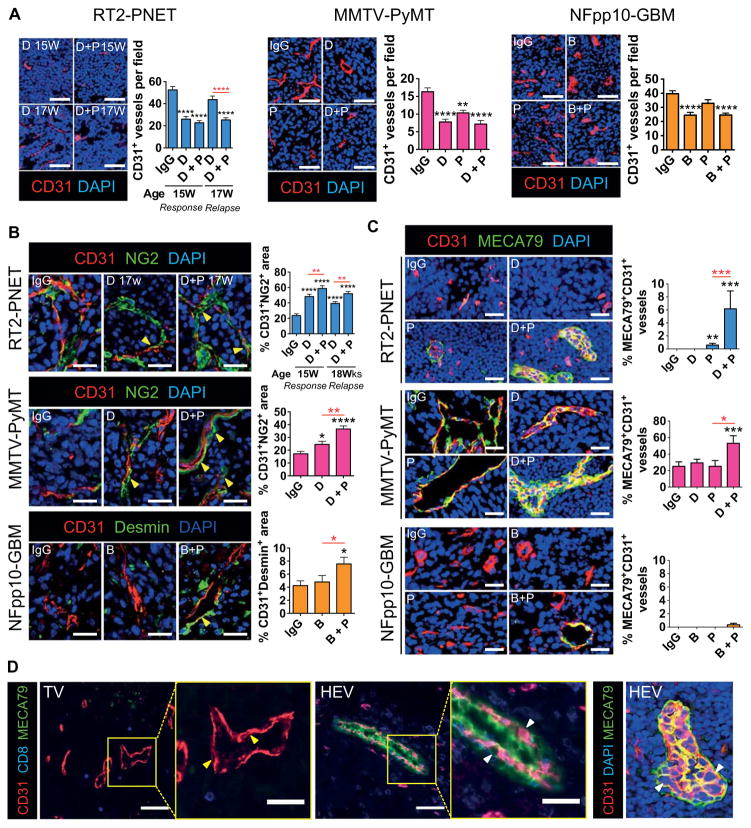
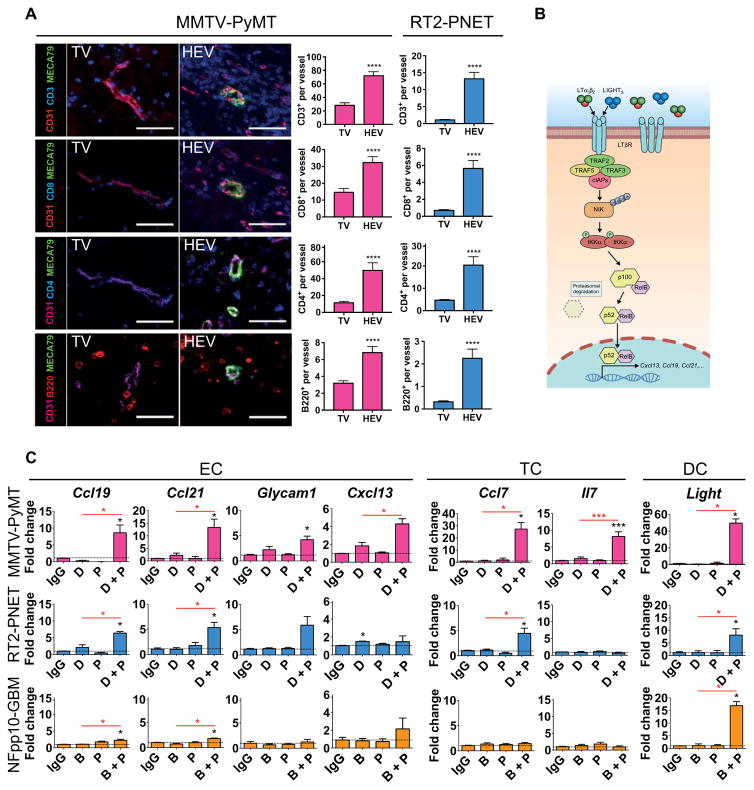
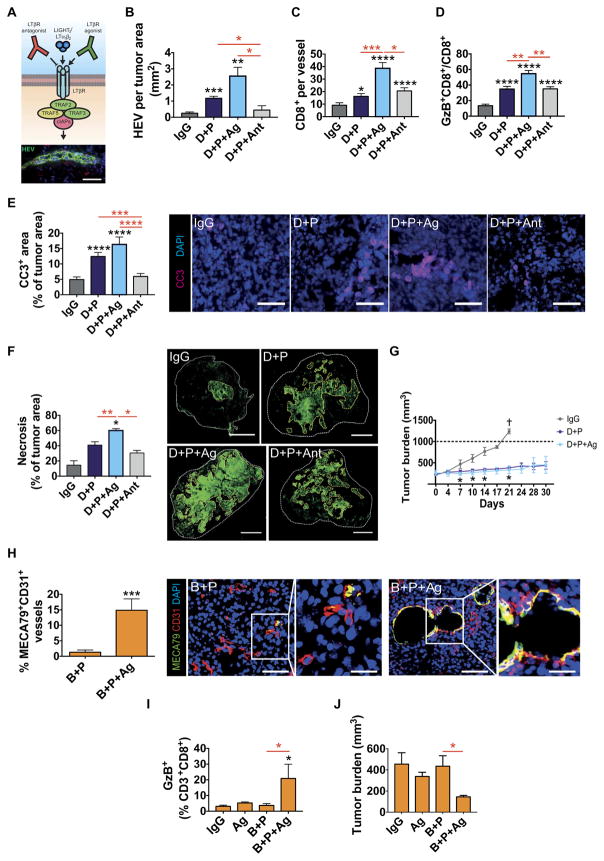
Inhibitors of VEGF (vascular endothelial growth factor)/VEGFR2 (vascular endothelial growth factor receptor 2) are commonly used in the clinic, but their beneficial effects are only observed in a subset of patients and limited by induction of diverse relapse mechanisms. We describe the up-regulation of an adaptive immunosuppressive pathway during antiangiogenic therapy, by which PD-L1 (programmed cell death ligand 1), the ligand of the negative immune checkpoint regulator PD-1 (programmed cell death protein 1), is enhanced by interferon-γ-expressing T cells in distinct intratumoral cell types in refractory pancreatic, breast, and brain tumor mouse models. Successful treatment with a combination of anti-VEGFR2 and anti-PD-L1 antibodies induced high endothelial venules (HEVs) in PyMT (polyoma middle T oncoprotein) breast cancer and RT2-PNET (Rip1-Tag2 pancreatic neuroendocrine tumors), but not in glioblastoma (GBM). These HEVs promoted lymphocyte infiltration and activity through activation of lymphotoxin β receptor (LTβR) signaling. Further activation of LTβR signaling in tumor vessels using an agonistic antibody enhanced HEV formation, immunity, and subsequent apoptosis and necrosis in pancreatic and mammary tumors. Finally, LTβR agonists induced HEVs in recalcitrant GBM, enhanced cytotoxic T cell (CTL) activity, and thereby sensitized tumors to antiangiogenic/anti-PD-L1 therapy. Together, our preclinical studies provide evidence that anti-PD-L1 therapy can sensitize tumors to antiangiogenic therapy and prolong its efficacy, and conversely, antiangiogenic therapy can improve anti-PD-L1 treatment specifically when it generates intratumoral HEVs that facilitate enhanced CTL infiltration, activity, and tumor cell destruction.


Conflict of interest statement

Competing interests: The authors declare that they have no competing interests.

Figures

Fig. 1
Fig. 1. Antiangiogenic therapy enhances PD-L1 expression in relapsing tumors
(A) FACS analysis of PD-L1+ cell composition of RT2-PNET, MMTV-PyMT, and NFpp10-GBM tumors treated with IgG or angiogenesis inhibitors. RT2-PNET: 15-week-old mice treated with DC101 represent treatment response, and 17-week-old mice represent relapse. Data are presented as means ± SEM. DC101 15W (weeks) versus IgG 15W (n = 4), P = 0.0286 for TC, P = 0.06571 for IC, and P = 0.0286 for EC; DC101 17W (n = 7) versus IgG 15W (n = 4), P = 0.0061 for TC, P = 0.0121 for IC, and P = 0.0061 for EC. MMTV-PyMT: DC101 versus IgG (n = 9), P < 0.0001 for TC, P = 0.0106 for IC, and P = 0.0423 for EC. NFpp10-GBM trial: B20S versus IgG (n = 7), P = 0.0286 for TC, P = 0.0070 for IC, and P = 0.4359 for EC. Statistical analysis by Mann-Whitney test. (B) Immunofluorescence staining of PD-L1+ cells (red), blood vessels (CD31+; green arrows), ICs (CD45+; yellow arrows), and RT2-PNET TCs (insulin+; orange arrows). Scale bars, 50 μm (left panels); 10 μm (right panels). DAPI, 4′, 6-diamidino-2-phenylindole.
Fig. 2
Fig. 2. IFNγ, but not hypoxia, increases PD-L1 expression during antiangiogenic therapy
(A) Immunofluorescence staining and quantitation of the hypoxia marker CA9 and PD-L1 in RT2-PNET (IgG and DC101, n = 6), MMTV-PyMT (IgG, n = 29; DC101, n = 18), and NFpp10-GBM (IgG and B20S, n = 5) tumors treated with IgG or angiogenesis inhibitors (AI). Scale bars, 50 μm. (B) FACS analysis of IFNγ+CD3+CD4+ and IFNγ+CD3+CD8+ T cells in RT2-PNET [IgG and DC101 (D), n = 6/6], MMTV-PyMT (IgG, n = 6/5; D, n = 6/6), and NFpp10-GBM [IgG, n = 6/7; B20S (B), n = 6/7] tumors. (C) FACS analysis of GzB+ CD3+CD8+ T cells in RT2-PNET (IgG and D, n = 6), MMTV-PyMT (IgG and D, n = 9), and NFpp10-GBM (IgG, n = 8; B, n = 9) tumors. (D) Quantitative polymerase chain reaction (qPCR) analysis of IFNγ-mediated genes Cxcl10, Mx1, and Ifit3 in FACS-sorted PD-L1 or PD-L1+ TCs, ECs, and ICs from RT2-PNET (TC, EC, and IC, n = 8), MMTV-PyMT (TC, EC, and IC, n = 8), and NFpp10-GBM (TC, EC, and IC, n = 4) tumors. For primers, see table S1. Data are presented as means ± SEM. *P < 0.05, **P < 0.01, and ***P < 0.001 (for exact P values, see table S2); Mann-Whitney test. Black asterisks represent P values for comparisons between IgG and DC101 or B20S.
Fig. 3
Fig. 3. Anti–PD-L1 enhances the efficacy of antiangiogenic therapy in RT2-PNET and MMTV-PyMT but not in NFpp10-GBM
(A) Bottom left: Tumor burden of RT2-PNET, IgG (13 to 15W), n = 8; D (13 to 15W), n = 8; anti–PD-L1 (P) (13 to 15W), n = 8; D + P (13 to 15W), n = 11; D (13 to 17W), n = 11; D + P (13 to 17W), n = 11. Top left: Survival of RT2-PNET, IgG, n = 10; D, n = 10; P, n = 10; D + P, n = 12. Top center: Tumor growth curves. Bottom center: Tumor burden of MMTV-PyMT (2 weeks), IgG, n = 6; D, n = 6; P, n = 6; D + P, n = 6. Right: Survival of NFpp10-GBM, IgG, n = 20; B, n = 15; P, n = 16; B + P, n = 18. (B) Immunofluorescence staining (yellow arrows) and quantitation of CD11b+pS6+ cells in RT2-PNET (IgG, n = 12; D 15W, n = 11; D + P 15W, n = 34; D 17W, n = 8; D + P 17W, n = 15), MMTV-PyMT (IgG, n = 20; D, n = 24; P, n = 20; D + P, n = 23), and NFpp10-GBM (IgG, n = 15; B, n = 20; P, n = 20; B + P, n = 24) tumors. Scale bars, 10 μm. (C) Quantitation of CD8+ and GzB+ cells in RT2-PNET (IgG, n = 9/6; D 15W, n = 9/6; P, n = 9/6; D + P 15W, n = 7/7; D 17W, n = 19/4; D + P 17W, n = 14/4), MMTV-PyMT (IgG, n = 18/9; D, n = 20/9; P, n = 24/9; D + P, n = 18/9), and NFpp10-GBM (IgG, n = 15/8; B, n = 15/9; P, n = 13/7; B + P, n = 14/9) tumors. (D) Quantitation of apoptotic cleaved caspase 3+ (CC3+) cells in RT2-PNET (IgG, n = 8; D 15W, n = 15; P, n = 20; D + P 15W, n = 29; D 17W, n = 25; D + P 17W, n = 25), MMTV-PyMT (IgG, D, P, and D + P, n = 8), and NFpp10-GBM (IgG, n = 5; B, n = 6; P, n = 3; B + P, n = 5) tumors. Data are presented as means ± SEM. *P < 0.05, **P < 0.01, ***P < 0.001, and ****P < 0.0001 (for exact P values, see table S2); Mann-Whitney test or log-rank test for survival. Black asterisks represent P values for comparisons between IgG and different treatments; red asterisks represent P values for other comparisons.
Fig. 4
Fig. 4. Combined anti–PD-L1 and antiangiogenic therapy stimulates infiltration and activation of DCs and CTLs in responding tumors
(A) Immunofluorescence staining and quantitation of CD8+ and CD11c+ cells in RT2-PNET (IgG, n = 11; D 15W, n = 9; D + P 15W, n = 18; D 17W, n = 11; D + P, n = 13), MMTV-PyMT (IgG, D, P, and D + P, n = 20), and NFpp10-GBM (IgG, n = 18; B, n = 20; P, n = 13; B + P, n = 14) tumors. Quantitation of CD11c+ infiltrates is shown on the right. Scale bars, 25 μm. (B) qPCR-based expression analysis of FACS-sorted DCs in RT2-PNET (IgG, n = 4; D, n = 8; P, n = 8; D + P, n = 15 to 16), MMTV-PyMT (IgG, n = 4; D, n = 8; P, n = 11; D + P, n = 8), and NFpp10-GBM (IgG, n = 4; B, n = 8; P, n = 8; B + P, n = 8) tumors. (C) qPCR analysis of perforin in CD3+CD8+ CTLs from RT2-PNET (IgG, n = 4; D, n = 8; P, n = 8; D + P, n = 16), MMTV-PyMT (IgG, n = 6; D, n = 18; P, n = 12; D + P, n = 16), and NFpp10-GBM (IgG, n = 8; B, n = 24; P, n = 40; B + P, n = 32) tumors. Dotted line indicates baseline gene expression in IgG-treated samples. Data are presented as means ± SEM. *P < 0.05, **P < 0.01, ***P < 0.001, and ****P < 0.0001 (for exact P values, see table S2); Mann-Whitney test. Black asterisks represent P values for comparisons between IgG and different treatments; red asterisks represent P values for other comparisons.
Fig. 5
Fig. 5. Combined antiangiogenic/anti–PD-L1therapystimulates vessel normalization and HEV formation in responding tumors
(A) Visualization and quantification of CD31+ blood vessels in RT2-PNET (IgG, D, and D + P, n = 15), MMTV-PyMT (IgG, n = 35; D, n = 25; P, n = 15; D + P, n = 28), and NFpp10-GBM (IgG, n = 35; B, n = 39; P, n = 15; B + P, n = 39) tumors. Scale bars, 50 μm. (B) Immunofluorescence staining of CD31 and NG2 or desmin and quantitation of pericyte-covered blood vessels in RT2-PNET (IgG, D, and D s+ P, n = 15), MMTV-PyMT (IgG, D, and D + P, n = 15), and NFpp10-GBM (IgG, B, and B + P, n = 15) tumors. Scale bars, 25 μm. (C) Images and quantitation of CD31+MECA79+ blood vessels in the different tumor types. Scale bars, 25 μm. (D) Visualization of CD31+MECA79 [tumor vessels (TV); flat ECs, yellow arrows] and CD31+MECA79+ (HEV; plump ECs, white arrows) tumor vessels. Scale bars, 50 μm (low-magnification images); 25 μm (high-magnification images). Data are presented as means ± SEM. *P < 0.05, **P < 0.01, ***P < 0.001, and ****P < 0.0001 (for exact P values, see table S2); Mann-Whitney test. Black asterisks represent P values for comparisons between IgG and different treatments; red asterisks represent P values for other comparisons.
Fig. 6
Fig. 6. Intratumoral HEVs increase lymphocyte infiltration
(A) Visualization and quantitation of CD3+, CD8+, and CD4+ T cells and B220+ B cells within 50 μm of MECA79 tumor vessels (TV) and MECA79+ tumor vessels (HEV). MMTV-PyMT: TV, n ≥ 42; HEV, n ≥ 20. RT2-PNET: TV, n ≥ 28; HEV, n ≥ 12. Scale bars, 50 μm. (B) Schematic of the LTβR/noncanonical NFκB signaling pathway that induces the expression of various HEV signature genes. (C) qPCR-based expression analysis of HEV signature genes in different FACS-sorted cell populations from MMTV-PyMT, RT2-PNET, and NFpp10-GBM. For all genes, n = 4 except Cxcl13 and Il7, n ≥ 4; Glycam1, n ≥ 3. Dotted line indicates baseline gene expression in IgG-treated samples. Data are presented as means ± SEM. *P < 0.05, **P < 0.01, ***P < 0.001, and ****P < 0.0001 (for exact P values, see table S2); Mann-Whitney test. Black asterisks represent P values for comparisons between IgG and different treatments; red asterisks represent P values for other comparisons.
Fig. 7
Fig. 7. LTβR-activation is implicated in HEV formation during antiangiogenic immunotherapy
(A) Top: Schematic of LTβR effects with agonistic and antagonistic anti-LTβR antibodies. Bottom: Image of an HEV. Scale bar, 50 μm. (B to G) MMTV-PyMT mice were treated as indicated. (B) Number of HEVs per square millimeter of tumor area. IgG, n = 8; D + P, n = 8; D + P + agonistic anti-LTβR (Ag), n = 5; D + P + antagonistic anti-LTβR (Ant), n = 5. (C) Number of CD8+ cells around tumor vessels. IgG, n = 21; D + P, n = 18; D + P + Ag, n = 39; D + P + Ant, n = 18. (D) Number of GzB+CD8+ cells per field. IgG, n = 10; D + P, n = 11; D + P + Ag, n = 13; D + P + Ant, n = 11. (E) Quantitation and visualization of CC3+ apoptotic cells. IgG, n = 25; D + P, n = 20; D + P + Ag, n = 27; D + P + Ant, n = 26. Scale bars, 50 μm. (F) Quantitation and visualization of necrotic areas in MMTV-PyMT tumors. IgG, n = 4; D + P, n = 5; D + P + Ag, n = 5; D + P + Ant, n = 4. Scale bars, 1 mm. (G) Tumor size in PyMT mice under different treatment conditions. IgG, n = 4; D + P, n = 4; D + P + Ag, n = 4. (H) Quantitation and visualization of MECA79+CD31+ tumor vessels in NFpp10-GBM tumors treated as indicated. B + P, n = 10; B + P + Ag, n = 9. Scale bars, 50 μm (low-magnification images); 20 μm (high-magnification images). (I) FACS analysis of GzB+CD3+CD8+ CTLs under the different treatment conditions. IgG, n = 3; Ag, n = 3; B + P, n = 4; B + P + Ag, n = 4. (J) Tumor burden of NFpp10-GBM mice under different treatment conditions. IgG and Ag, n = 3; B + P and B + P + Ag, n = 4. Data are presented as means ± SEM. *P < 0.05, **P < 0.01, ***P < 0.001, and ****P < 0.0001 (for exact P values, see table S2); Mann-Whitney test. Black asterisks represent P values for comparisons between IgG and different treatments; red asterisks represent P values for other comparisons.

Comment in

References

    1. Hanahan D, Weinberg RA. Hallmarks of cancer: The next generation. Cell. 2011;144:646–674. - PubMed
    1. Motz GT, Coukos G. The parallel lives of angiogenesis and immunosuppression: Cancer and other tales. Nat Rev Immunol. 2011;11:702–711. - PubMed
    1. Mahoney KM, Rennert PD, Freeman GJ. Combination cancer immunotherapy and new immunomodulatory targets. Nat Rev Drug Discov. 2015;14:561–584. - PubMed
    1. Callahan MK, Postow MA, Wolchok JD. Targeting T cell co-receptors for cancer therapy. Immunity. 2016;44:1069–1078. - PubMed
    1. Sharma P, Allison JP. Immune checkpoint targeting in cancer therapy: Toward combination strategies with curative potential. Cell. 2015;161:205–214. - PMC - PubMed

Publication types

MeSH terms

Substances