. 2017 Apr 12;7(1):839.
doi: 10.1038/s41598-017-00876-4.

Ecology of cold environments: new insights of bacterial metabolic adaptation through an integrated genomic-phenomic approach

Affiliations

Ecology of cold environments: new insights of bacterial metabolic adaptation through an integrated genomic-phenomic approach

Stefano Mocali et al. Sci Rep. .

Abstract

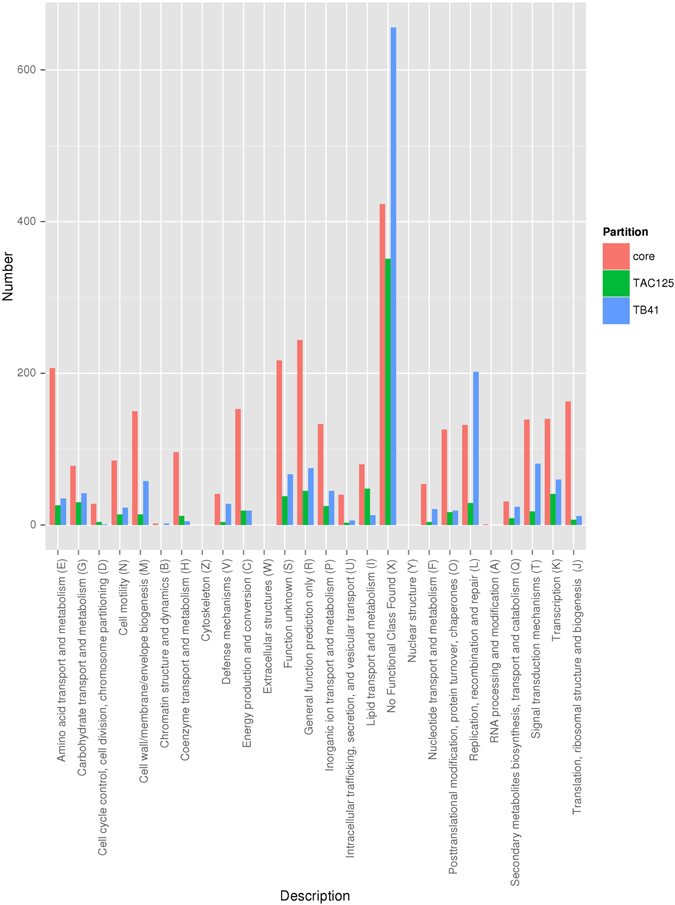
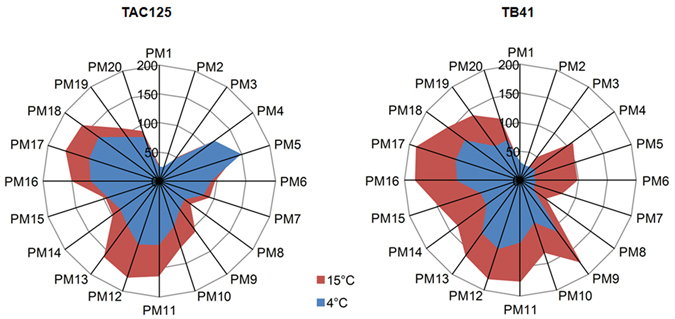
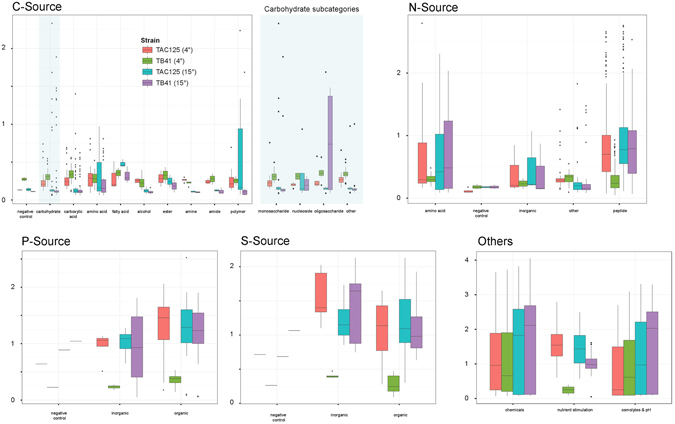
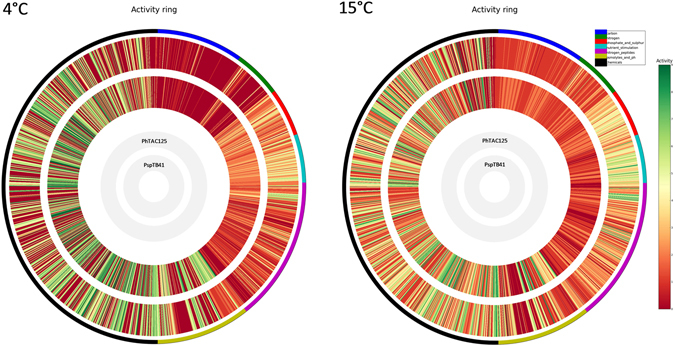
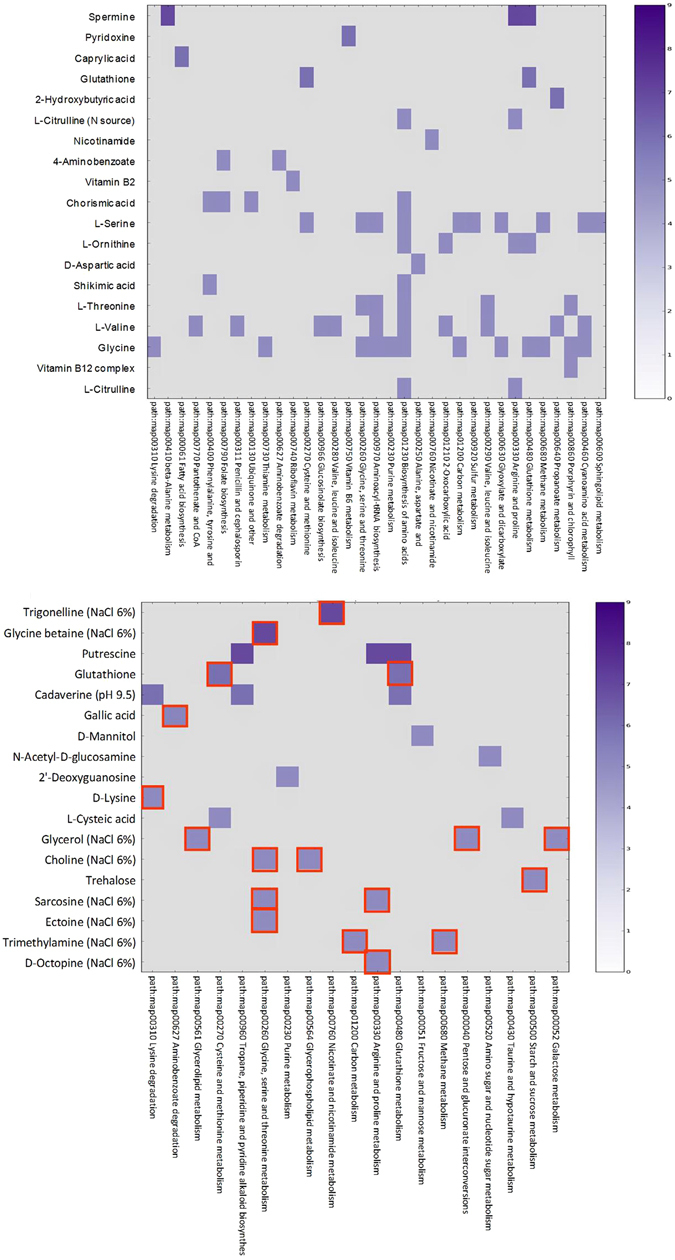
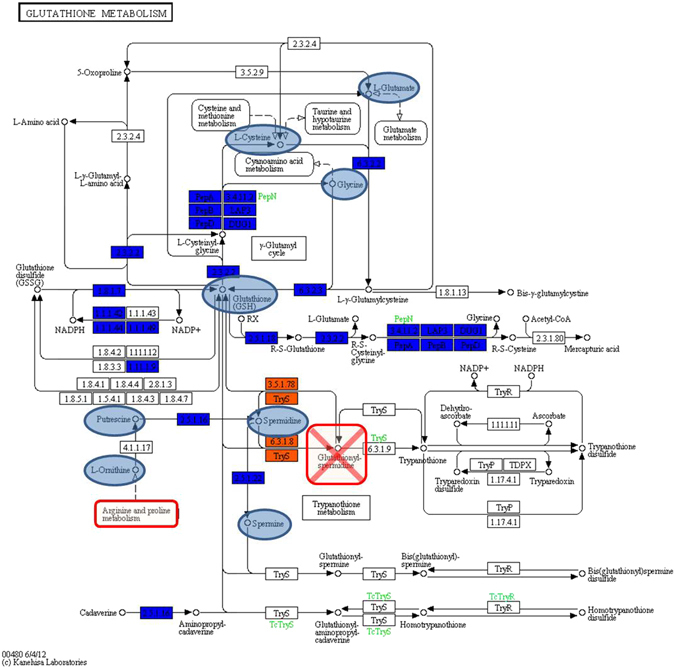
Cold environments dominate Earth's biosphere, hosting complex microbial communities with the ability to thrive at low temperatures. However, the underlying molecular mechanisms and the metabolic pathways involved in bacterial cold-adaptation mechanisms are still not fully understood. Herein, we assessed the metabolic features of the Antarctic bacterium Pseudoalteromonas haloplanktis TAC125 (PhTAC125), a model organism for cold-adaptation, at both 4 °C and 15 °C, by integrating genomic and phenomic (high-throughput phenotyping) data and comparing the obtained results to the taxonomically related Antarctic bacterium Pseudoalteromonas sp. TB41 (PspTB41). Although the genome size of PspTB41 is considerably larger than PhTAC125, the higher number of genes did not reflect any higher metabolic versatility at 4 °C as compared to PhTAC125. Remarkably, protein S-thiolation regulated by glutathione and glutathionylspermidine appeared to be a new possible mechanism for cold adaptation in PhTAC125. More in general, this study represents an example of how 'multi-omic' information might potentially contribute in filling the gap between genotypic and phenotypic features related to cold-adaptation mechanisms in bacteria.


Conflict of interest statement

The authors declare that they have no competing interests.

Figures

Figure 1
Figure 1
Frequency (%) of the core and specific genes associated to COG categories in the Antarctic bacteria PhTAC125 and PspTB41 based on genomic data. COG functional categories: RNA processing and modification (A); Chromatin structure and dynamics (B); Energy production and conversion (C); Cell cycle control, cell division, chromosome partitioning (D); Amino acid transport and metabolism (E); Nucleotide transport and metabolism (F); Carbohydrate transport and metabolism (G); Coenzyme transport and metabolism (H); Lipid transport and metabolism (I); Translation, ribosomal structure and biogenesis (J); Transcription (K); Replication, recombination and repair (L); Cell wall/membrane/envelope biogenesis (M); Cell motility (N); Posttranslational modification, protein turnover, chaperones (O); Inorganic ion transport and metabolism (P); Secondary metabolites biosynthesis, transport and catabolism (Q); General function prediction only (R); Function unknown (S); Signal transduction mechanisms (T); Intracellular trafficking, secretion, and vesicular transport (U); Defense mechanisms (V); Extracellular structures (W); No Functional Class Found (X); Nuclear structure (Y); Cytoskeleton (Z).
Figure 2
Figure 2
Phenotype Microarray (PM) experiment. Radar plots representing the number of the different growth phenotypes of the PhTAC125 and PspTB41 strains as assessed by the PM experiment at 4 °C (blue) and 15 °C (red). Each radial strip corresponds to a single PM microplate (PM1-20). PM categories: Carbon Sources (PM1, PM2), Nitrogen Sources (PM3), Phosphorus and Sulfur Sources (PM4), Nutrient Supplements (PM5), Peptide Nitrogen sources (PM6, PM7, PM8), Osmolytes (PM9), pH (PM10) and Chemicals (PM11-20).
Figure 3
Figure 3
The utilization of carbon (C), nitrogen (N) phosphorous (P) and sulfur (S) sources under 4 °C and 15 °C. A boxplot displaying the PM 4–8 source utilization. The figures include all positive phenotypes (gray circles) for PhTAC125 and PspTB41 (at 4 °C and 15 °C). The carbohydrate group was further divided into sub-types.
Figure 4
Figure 4
High-throughput metabolic activity of PhTAC125 and PspTB41 at 4 °C and 15 °C. The metabolic activity is expressed as AV value and colored from red (low activity) to green (high activity) and visualized through the DuctApe Activity rings, indicating the PM substrates differentially utilized by PhTAC125 and PspsTB41 at 4 °C and 15 °C. Circles display (from the outside): (1) the metabolic activity of PhTAC125 strain; (2) the metabolic activity of TB41 strain; the lane external to the circles is color-coded according to different functional PM categories: blue indicates Carbon sources (PM1,2); green indicates Nitrogen sources (PM3); red indicates Phosphate and Sulfure substrates (PM4); light blue indicates Nutrient Stimulation substrates (PM5); purple indicates Nitrogen Peptides (PM6,7,8); light green indicates Osmolytes and pH (PM9,10); black indicates Chemical compounds (PM11-20).
Figure 5
Figure 5
Combined genome/phenome variability of PhTAC125 and PspTB41 (red-border squares) strains at 4 °C (a) and 15 °C (b). The main PM substrates (AV >5) which were differently used by the two strains are reported on the Y axis whereas the metabolic pathways involved are reported on X axis. The color indicates the magnitude of such AV difference (0–9).
Figure 6
Figure 6
Glutathione (GSH) metabolic network analysis using the dape module (KEGG map00480, reproduced with permission of Kanehisa Laboratories, Japan). Boxes represent reactions while small circles represent compounds. Core reactions are colored blue, variable reactions are colored orange; blue circles represent compounds better used by PhTAC125 at 4 °C, compared to PspTB41. The orange reactions indicates that PspTB41 is not able to carry out reactions catalyzed by glutathionylspermidine amidase/synthetase (3.5.1.78) and glutathionylspermidine synthase (6.3.1.8), resulting in its inability on producing glutathionylspermidine and S-thiolation. Gluathione metabolism is strictly related to ‘Arginine and Proline metabolism’.

References

    1. Pomeroy LR. The ocean’s food web, a changing paradigm. Bioscience. 1974;24(9):499–504. doi: 10.2307/1296885. - DOI
    1. Whitman WB, Coleman DC, Wiebe WJ. Prokaryotes: the unseen majority. P Natl Acad Sci Usa. 1998;95(12):6578–6583. doi: 10.1073/pnas.95.12.6578. - DOI - PMC - PubMed
    1. Azam F, Malfatti F. Microbial structuring of marine ecosystems. Nat Rev Microbiol. 2007;5:782–791. doi: 10.1038/nrmicro1747. - DOI - PubMed
    1. Feller G, Gerday C. Psychrophilic enzymes: hot topics in cold adaptation. Nat Rev Microbiol. 2003;1(3):200–208. doi: 10.1038/nrmicro773. - DOI - PubMed
    1. Delille D. Abundance and function of bacteria in the Southern Ocean. Cell Mol Biol. 2004;50:543–551. - PubMed

Publication types