

Global analysis of glycoproteins identifies markers of endotoxin tolerant monocytes and GPR84 as a modulator of TNFα expression
- PMID: 28404994
- PMCID: PMC5429802
- DOI: 10.1038/s41598-017-00828-y
Global analysis of glycoproteins identifies markers of endotoxin tolerant monocytes and GPR84 as a modulator of TNFα expression
Abstract
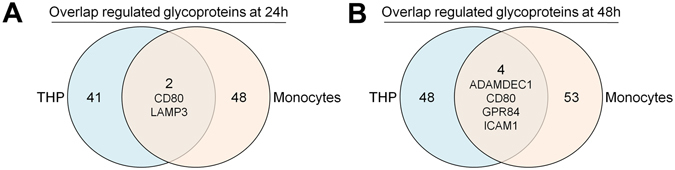
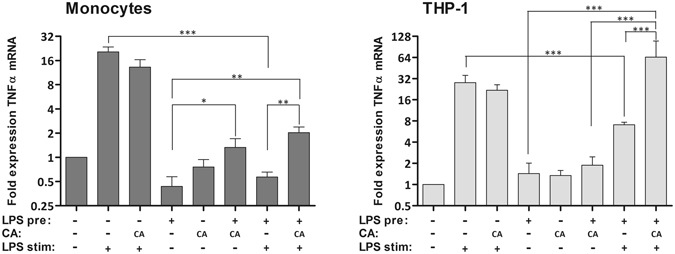
Exposure of human monocytes to lipopolysaccharide (LPS) induces a temporary insensitivity to subsequent LPS challenges, a cellular state called endotoxin tolerance. In this study, we investigated the LPS-induced global glycoprotein expression changes of tolerant human monocytes and THP-1 cells to identify markers and glycoprotein targets capable to modulate the immunosuppressive state. Using hydrazide chemistry and LC-MS/MS analysis, we analyzed glycoprotein expression changes during a 48 h LPS time course. The cellular snapshots at different time points identified 1491 glycoproteins expressed by monocytes and THP-1 cells. Label-free quantitative analysis revealed transient or long-lasting LPS-induced expression changes of secreted or membrane-anchored glycoproteins derived from intracellular membrane coated organelles or from the plasma membrane. Monocytes and THP-1 cells demonstrated marked differences in glycoproteins differentially expressed in the tolerant state. Among the shared differentially expressed glycoproteins G protein-coupled receptor 84 (GPR84) was identified as being capable of modulating pro-inflammatory TNFα mRNA expression in the tolerant cell state when activated with its ligand Decanoic acid.
Conflict of interest statement
The authors declare that they have no competing interests.
Figures


Similar articles
-
CD163 and CD206 expression does not correlate with tolerance and cytokine production in LPS-tolerant human monocytes.Cytometry B Clin Cytom. 2017 May;92(3):192-199. doi: 10.1002/cyto.b.21321. Epub 2016 Feb 8. Cytometry B Clin Cytom. 2017. PMID: 26352275
-
Staphylococcus aureus induces tolerance in human monocytes accompanied with expression changes of cell surface markers.Front Immunol. 2023 Mar 31;14:1046374. doi: 10.3389/fimmu.2023.1046374. eCollection 2023. Front Immunol. 2023. PMID: 37063823 Free PMC article.
-
Bacterial lipoprotein-induced self-tolerance and cross-tolerance to LPS are associated with reduced IRAK-1 expression and MyD88-IRAK complex formation.J Leukoc Biol. 2006 Apr;79(4):867-75. doi: 10.1189/jlb.0905505. Epub 2006 Feb 3. J Leukoc Biol. 2006. PMID: 16461741
-
Moesin: a potential LPS receptor on human monocytes.J Endotoxin Res. 2001;7(4):281-6. J Endotoxin Res. 2001. PMID: 11717582
-
Differential induction of tumor necrosis factor alpha and manganese superoxide dismutase by endotoxin in human monocytes: role of protein tyrosine kinase, mitogen-activated protein kinase, and nuclear factor kappaB.J Cell Physiol. 2000 Mar;182(3):381-9. doi: 10.1002/(SICI)1097-4652(200003)182:3<381::AID-JCP9>3.0.CO;2-F. J Cell Physiol. 2000. PMID: 10653605
Cited by
-
On-target and off-target effects of novel orthosteric and allosteric activators of GPR84.Sci Rep. 2019 Feb 12;9(1):1861. doi: 10.1038/s41598-019-38539-1. Sci Rep. 2019. PMID: 30755705 Free PMC article.
-
Differences in the Genomic Profiles of Immunoparalyzed and Nonimmunoparalyzed Children With Sepsis: A Pilot Study.Pediatr Crit Care Med. 2022 Feb 1;23(2):79-88. doi: 10.1097/PCC.0000000000002860. Pediatr Crit Care Med. 2022. PMID: 35119428 Free PMC article.
-
Dynamics of Dual Specificity Phosphatases and Their Interplay with Protein Kinases in Immune Signaling.Int J Mol Sci. 2019 Apr 27;20(9):2086. doi: 10.3390/ijms20092086. Int J Mol Sci. 2019. PMID: 31035605 Free PMC article.
-
Type 2 diabetes is associated with increased circulating levels of 3-hydroxydecanoate activating GPR84 and neutrophil migration.iScience. 2022 Nov 26;25(12):105683. doi: 10.1016/j.isci.2022.105683. eCollection 2022 Dec 22. iScience. 2022. PMID: 36561890 Free PMC article.
-
Discovery and Characterization of Novel Antagonists of the Proinflammatory Orphan Receptor GPR84.ACS Pharmacol Transl Sci. 2021 Sep 7;4(5):1598-1613. doi: 10.1021/acsptsci.1c00151. eCollection 2021 Oct 8. ACS Pharmacol Transl Sci. 2021. PMID: 34661077 Free PMC article.
References
Publication types
MeSH terms
Substances
LinkOut - more resources
Full Text Sources
Other Literature Sources
Research Materials
