. 2017 Apr 12;7(1):849.
doi: 10.1038/s41598-017-00829-x.

Surpassing light-induced cell damage in vitro with novel cell culture media

Affiliations

Surpassing light-induced cell damage in vitro with novel cell culture media

John H Stockley et al. Sci Rep. .

Abstract

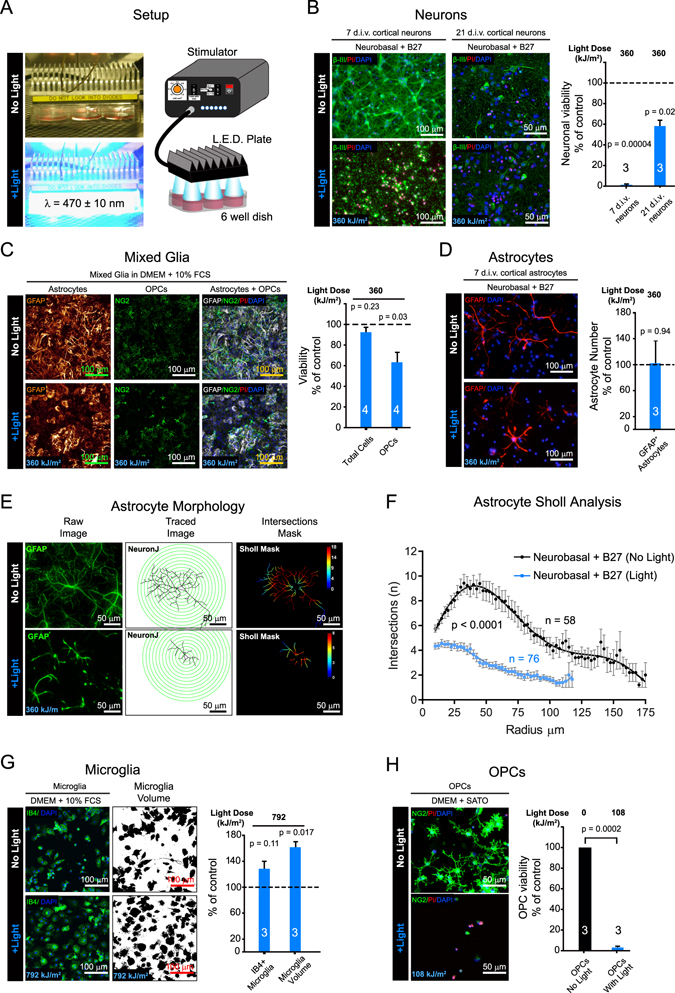
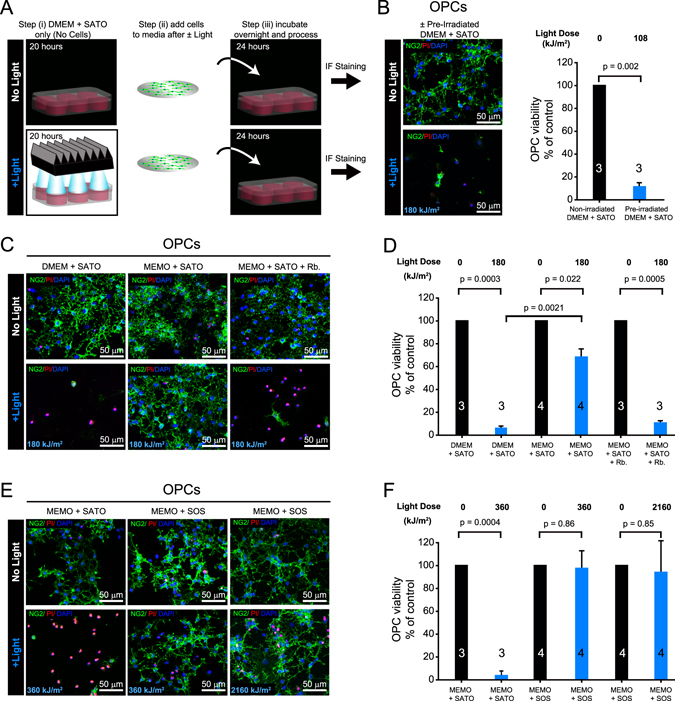
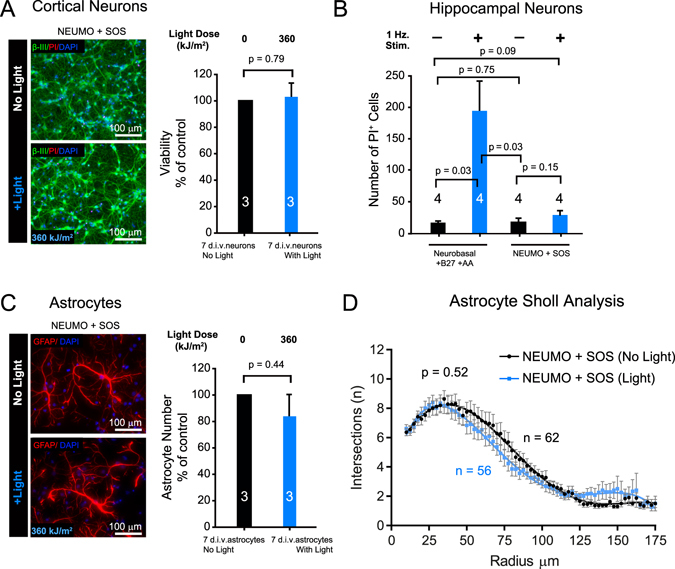
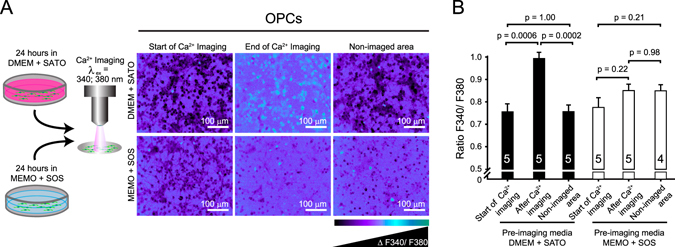
Light is extensively used to study cells in real time (live cell imaging), separate cells using fluorescence activated cell sorting (FACS) and control cellular functions with light sensitive proteins (Optogenetics). However, photo-sensitive molecules inside cells and in standard cell culture media generate toxic by-products that interfere with cellular functions and cell viability when exposed to light. Here we show that primary cells from the rat central nervous system respond differently to photo-toxicity, in that astrocytes and microglia undergo morphological changes, while in developing neurons and oligodendrocyte progenitor cells (OPCs) it induces cellular death. To prevent photo-toxicity and to allow for long-term photo-stimulation without causing cellular damage, we formulated new photo-inert media called MEMO and NEUMO, and an antioxidant rich and serum free supplement called SOS. These new media reduced the detrimental effects caused by light and allowed cells to endure up to twenty times more light exposure without adverse effects, thus bypassing the optical constraints previously limiting experiments.


Conflict of interest statement

Under a licensing agreement between Cambridge Enterprise and Cell Guidance Systems, J.H.S. and R.T.K. are entitled to a share of royalty received by sales of MEMO, NEUMO and SOS, an arrangement being managed by Cambridge Enterprise and Cell Guidance Systems.

Figures

Figure 1
Figure 1
Light induces cytotoxicity in vitro. (a) Blue light (470 ± 10 nm) LED setup with control unit regulating delivery of power, pulse duration and frequency of light to cells in 6 well dish. (b) Viabilities of cortical neurons (β–III-tubulin+ (β–III)) of 7 or 21 days in vitro (d.i.v.) using propidium iodide (PI) exclusion assay after ± light at indicated light dose (units of kJ/m2). (c) Mixed glia (astrocytes (GFAP+) and OPCs (NG2+)) viabilities determined using PI exclusion assay after ± light treatment. (d) Representative images and quantification of GFAP+ astrocyte numbers in 7 d.i.v. cortical neuron enriched cultures after ± light at indicated dose. (e) Example of astrocyte morphological tracings after ± light treatment using GFAP staining and NeuronJ tracing and concentric radii of 10 µm steps overlaid in green to aid the reader. Sholl intersection masks with heat map of intersection number inset, generated using Sholl Analysis software from NeuronJ tracings. (f) Non-linear fitted plots of data from Sholl Analysis of astrocytes kept in the dark (black line: 58 cells analyzed) or exposed to light (blue line: 76 cells analyzed) and p value calculated from two tailed unpaired t-test of mean intersection number. (g) Microglial numbers (IB4+ cells) and volumes from binarised image masks of IB4+ cells using ImageJ and expressed as percentage area after ± light. (h) Representative images and quantification of NG2+ cell viabilities using PI exclusion assay in OPC enriched cultures after ± light treatment at 108 kJ/m2 light dose. All above histograms are normalized to controls with data representing means ± s.e.m. of a number of biological replicates (n indicated on each histogram) and p values from Student’s two tailed unequal variance t-test. Black and blue histograms represent conditions kept in the dark or exposed to light respectively, and dashed lines are control values. Media conditions for experiments are described above their respective images. Light doses in kJ/m2 are shown above histograms and as insets within representative images of cells treated with light.
Figure 2
Figure 2
In vitro photo-toxicity can be resolved with a new culture medium. (a) Setup of experiment to test media for photo-reactive components. Step (i) media is treated ± light stimulation (W = 0.3 mW/mm2, t = 5 ms and f = 1 Hz) for 20 hours delivering 108 kJ/m2 of light, step (ii) after which viable cells are placed in ± pre-irradiated media for 24 hours before step (iii) analysis by PI exclusion assay. (b) Viabilities of OPCs 24 hours after placement into DMEM + SATO treated ± light (108 kJ/m2). Note: the robust loss of OPC viability in pre-irradiated media is similar to irradiating cells directly with light (see Fig. 1h). (c and d) Significant improvement (p = 0.0021) of OPC viability in photo-inert media MEMO + SATO compared to DMEM + SATO when treated with light (180 kJ/m2), but both conditions retain significant loss of viabilities compared to cells kept in dark (p = 0.0003 and p = 0.022 respectively), and addition of riboflavin (Rb.), a component absent in MEMO, restores highly significant loss (p = 0.0005) of OPC viability when treating cells with light. (e and f) Increasing light dose to 360 kJ/m2 induces robust loss of OPC viability in MEMO + SATO, however, combining MEMO + SOS protects OPC viabilities during light doses of 360 kJ/m2 and up to 2160 kJ/m2 (W = 0.6 mW/mm2, t = 0.5 ms and f = 10 Hz), a dose 20 fold greater than the 108 kJ/m2 dose that induced almost complete loss of OPC viability in standard conditions of DMEM + SATO (see Fig. 1h). All above histograms are normalized to controls with data representing means ± s.e.m. of a number of biological replicates (value within or above each histogram) and p values from Student’s two tailed unequal variance t-test. Black and blue histograms represent conditions kept in the dark or exposed to light respectively. Light doses in kJ/m2 are shown above histograms and as insets within representative images of irradiated experiments. Cell culture media conditions are described above images and under respective histograms.
Figure 3
Figure 3
Light induced cytotoxicity can be prevented with new culture medium. (a) Viability of 7 d.i.v. β-III+ cortical neurons ± light at indicated dose in NEUMO (in replacement of Neurobasal) and SOS (in replacement of B27) using PI exclusion assay. (b) Number of PI positive cells in 7 d.i.v. hippocampal neuronal cultures ± optogenetic stimulation at 1 Hz in control media conditions (Neurobasal + B27) with additional antioxidants (AA) and in NEUMO + SOS. Note: the protection of cortical and hippocampal neurons during treatment with light only in NEUMO + SOS media conditions. (c) Representative images and quantification of GFAP+ astrocyte numbers in 7 d.i.v. cortical neuron enriched cultures after ± light at indicated dose in NEUMO + SOS. (d) Non-linear fitted plots from Sholl Analysis of astrocytes kept in the dark (black line: 62 cells analyzed) or exposed to light (blue line: 56 cells analyzed) and p value calculated from two tailed unpaired t-test of mean intersection number. All above histograms are normalized to controls (with the exception of b) and data represents means ± s.e.m. of a number of biological replicates (value within or above each histogram) and p-values from Student’s two tailed unequal variance t-test. Black and blue histograms represent conditions kept in the dark or exposed to light respectively. Light doses in kJ/m2 are shown above histograms and as insets within representative images of irradiated experiments. Cell culture media conditions are described above images and under respective histograms.
Figure 4
Figure 4
Preventing photo-toxicity during calcium imaging. (a) Schematic of OPCs taken from DMEM + SATO based media and MEMO + SOS based media for ratiometric Fura2-AM Ca2+-imaging (λex = 340; 380 nm: UV light) and the representative images acquired at the start, at the end of Ca2+ imaging and in non-imaged areas at the end of experiment. (b) Ratiometric Ca2+ changes in OPCs at the start, after imaging or in non-imaged areas after OPCs were pre-treated in DMEM + SATO (closed histograms) or MEMO + SOS (open histograms) based media. Histograms show means ± s.e.m. of a number of biological replicates (value within or above each histogram) and p-values from Student’s two tailed unequal variance t-test.
Figure 5
Figure 5
The new media preserves normal cell function. (a) Comparison of the effect of DMEM + SATO and MEMO + SATO based media upon OPC migration over 4 days from agarose drop (Brightfield images), OPC proliferation using NG2 and Ki67 staining after 3 days with mitogens PDGF-aa and FGF-b (middle panel) and OPC differentiation with terminal differentiation marker MBP after 5 days of mitogen withdrawal and treatment with T3 (right panel). (b) Data from (a) analyzed by average distances from edge of drop to corona of migrated cells, percentages of NG2+ cells with Ki67+ or EdU+ and percentages of MBP+ cells and percentage MBP area generated for differentiation, and all normalized to DMEM + SATO values with data representing means ± s.e.m. of a number of biological replicates (value within or above each histogram) and p-values from Student’s two tailed unequal variance t-test. (c) Comparison of neural epithelial cell differentiation from human iPSC generated embryonic bodies using serum free supplements N2+B27 (left hand panels) or SOS (right hand panels) to generate neurons (β-III) and astrocytes (GFAP) after approximately 5 weeks in vitro.

Similar articles

Cited by

References

    1. Wang RJ. Effect of room fluorescent light on the deterioration of tissue culture medium. In Vitro. 1976;12:19–22. doi: 10.1007/BF02832788. - DOI - PubMed
    1. Yawo H, Asano T, Sakai S, Ishizuka T. Optogenetic manipulation of neural and non-neural functions. Dev Growth Differ. 2013;55:474–490. doi: 10.1111/dgd.12053. - DOI - PubMed
    1. Cox S, et al. Bayesian localization microscopy reveals nanoscale podosome dynamics. Nat Methods. 2011;9:195–200. doi: 10.1038/nmeth.1812. - DOI - PMC - PubMed
    1. Henriques R, Griffiths C, Rego H, Mhlanga M. PALM and STORM: Unlocking live-cell super-resolution. Biopolymers. 2011;95:322–331. doi: 10.1002/bip.21586. - DOI - PubMed
    1. St-Pierre F, et al. High-fidelity optical reporting of neuronal electrical activity with an ultrafast fluorescent voltage sensor. Nat Neurosci. 2014;17:884–889. doi: 10.1038/nn.3709. - DOI - PMC - PubMed

Publication types