. 2017 Mar 28:10:29-39.
doi: 10.2147/JIR.S128292. eCollection 2017.

Oxidant-induced autophagy and ferritin degradation contribute to epithelial-mesenchymal transition through lysosomal iron

Affiliations

Oxidant-induced autophagy and ferritin degradation contribute to epithelial-mesenchymal transition through lysosomal iron

Apostolos Sioutas et al. J Inflamm Res. .

Abstract

Purpose: Transforming growth factor (TGF)-β1 triggers epithelial-mesenchymal transition (EMT) through autophagy, which is partly driven by reactive oxygen species (ROS). The aim of this study was to determine whether leaking lysosomes and enhanced degradation of H-ferritin could be involved in EMT and whether it could be possible to prevent EMT by iron chelation targeting of the lysosome.

Materials and methods: EMT, H-ferritin, and autophagy were evaluated in TGF-β1-stimulated A549 human lung epithelial cells cultured in vitro using Western blotting, with the additional morphological assessment of EMT. By using immunofluorescence and flow cytometry, lysosomes and ROS were assessed by acridine orange and 6-carboxy-2',7'-dichlorodihydrofluorescein acetate assays, respectively.

Results: TGF-β1-stimulated cells demonstrated a loss of H-ferritin, which was prevented by the antioxidant N-acetyl-L-cysteine (NAC) and inhibitors of lysosomal degradation. TGF-β1 stimulation generated ROS and autophagosome formation and led to EMT, which was further promoted by the additional ROS-generating cytokine, tumor necrosis factor-α. Lysosomes of TGF-β1-stimulated cells were sensitized to oxidants but also completely protected by lysosomal loading with dextran-bound deferoxamine (DFO). Autophagy and EMT were prevented by NAC, DFO, and inhibitors of autophagy and lysosomal degradation.

Conclusion: The findings of this study support the role of enhanced autophagic degradation of H-ferritin as a mechanism for increasing the vulnerability of lysosomes to iron-driven oxidant injury that triggers further autophagy during EMT. This study proposes that lysosomal leakage is a novel pathway of TGF-β1-induced EMT that may be prevented by iron-chelating drugs that target the lysosome.

Keywords: A549 cells; COPD; pulmonary disease; pulmonary fibrosis; transforming growth factor; tumor necrosis factor.


Conflict of interest statement

Disclosure The authors report no conflicts of interest in this work.

Figures

Figure 1
Figure 1
(A) Representative Western blot and (B) summary of densitometric analysis of H-ferritin in cells following treatment as indicated. A549 cells were exposed (or not) for 72 h to nonlethal concentrations of TGF-β1 (10 ng/mL) ± DFO (0.1 mM), NAC (5 mM), CQ (10 μM), baf (10 nM), a mixture of pepstatin A (100 μM) and E-64d (10 μM), or lact (5 μM). *p<0.05, **p<0.01 (vs. TGF-β1-exposed control cells); Xp<0.05 (vs. control cells). (C) H2DCFDA fluorescence as a reflection of ROS formation was assessed in cells treated as indicated before (open symbols) and after (symbols in black) GO exposure. A549 cells were exposed (or not) for 72 h to TGF-β1 (10 ng/mL), TNF-α (100 ng/mL), or TGF-β1 (10 ng/mL) + TNF-α (100 ng/mL). Cytofluorometric analysis was performed before and after oxidative stress for 60 min by a stable physiological concentration of H2O2 (~120 μM), generated by adding a stock solution of GO to the culture medium at standard culture conditions. *p<0.05 and ***p<0.001 (vs. non-GO-exposed control cells), §p<0.05 and §§§p<0.001 (vs. non-GO-exposed cells), XXXp<0.001 (vs. TGF-β1-stimulated cells). (D) Representative Western blot and (E) summary of densitometric analysis of autophagosome formation, reflected by the marker LC3-II in A549 cells following treatments as indicated. *p<0.05, **p<0.01 (vs. control); Xp<0.05 (vs. TGF-β1). Values are expressed as means ± 1 SD, n=2–5 (independently performed). Abbreviations: baf, bafilomycin; CQ, chloroquine diphosphate salt; DFO, dextran-bound deferoxamine; GAPDH, glyceraldehyde-3-phosphate dehydrogenase; GO, glucose oxidase; H2DCFDA, 6-carboxy-2′,7′-dichlorodihydrofluorescein acetate; lact, lactacystin; 3-MA, 3-methyladenine; NAC, N-acetyl-l-cysteine; SD, standard deviation; TGF, transforming growth factor; TNF-α, tumor necrosis factor-α.
Figure 2
Figure 2
EMT reflected by the expression of cell type–specific markers in cultures treated as indicated. A549 cells were exposed (or not) to nonlethal concentrations of TGF-β1 (10 ng/mL), TNF-α (100 ng/mL), or TGF-β1 (10 ng/mL) + TNF-α (100 ng/mL). Cells were treated with the agents for 72 h before being collected to Western blot. A panel of epithelial markers (ZO-1 and E-cadherin) and mesenchymal markers (vimentin and N-cadherin) were tested. (A) Representative Western blot. (B) Summary of densitometric analysis of one representative marker (vimentin). Values are expressed as means ± 1 SD, n=4 (independently performed). *p<0.05 (vs. control), Xp<0.05 (vs. TGF-β1). Compared to untreated control cells, corresponding significant changes following the same treatments were demonstrated for ZO-1 (n=3), E-cadherin (n=4), and N-cadherin (n=3); results of the densitometric analysis are not shown. Corresponding morphologic appearance of EMT is illustrated by micrographs; (C) control cells, (D) TGF-β1-stimulated cells, (E) TNF-α-stimulated cells, and (F) TGF-β1 + TNF-α-stimulated cells. Abbreviations: EMT, epithelial–mesenchymal transition; GAPDH, glyceraldehyde-3-phosphate dehydrogenase; SD, standard deviation; TGF, transforming growth factor; TNF-α, tumor necrosis factor-α; ZO-1, zonula occludens-1.
Figure 3
Figure 3
Autophagosome and ROS formation in A549 cells treated with the autophagosome inhibitor 3-MA at nonlethal concentrations. Cells were treated with the agents for 72 h before being collected to Western blot or analyzed in the flow cytometer. (A) Representative Western blot. (B) Summary of densitometric analysis. Values are expressed as means ± 1 SD, n=2–4 (independently performed). *p<0.05 (vs. TGF-β1-exposed cells). (C) H2DCFDA fluorescence. Values are expressed as means ± 1 SD, n=5–7 (independently performed). ***p<0.001 (vs. TGF-β1-exposed cells). Abbreviations: GAPDH, glyceraldehyde-3-phosphate dehydrogenase; H2DCFDA, 6-carboxy-2′,7′-dichlorodihydrofluorescein acetate; 3-MA, 3-methyladenine; ROS, reactive oxygen species; SD, standard deviation; TGF, transforming growth factor; TNF-α, tumor necrosis factor-α.
Figure 4
Figure 4
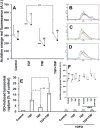
(A) AO induced red fluorescence reflecting the acidic vacuome was assessed following treatments as indicated before (open symbols) and after (symbols in black) GO exposure. A549 cells were exposed (or not) for 72 h to nonlethal concentrations of TGF-β1 (10 ng/mL), TNF-α (100 ng/mL), or TGF-β1 (10 ng/mL) + TNF-α (100 ng/mL). Cytofluorometric analysis was performed before and after oxidative stress for 60 min by a stable physiological concentration of H2O2 (~120 μM), generated by adding a stock solution of GO to the culture medium at standard culture conditions. Note the significantly greater loss of AO red fluorescence following GO in TGF-β1-stimulated cells (p<0.05). Values are expressed as means ± 1 SD, n=7 (independently performed). ***p<0.001 (vs. non-GO-exposed control cells), §p<0.05 and §§p<0.01 (vs. non-GO-exposed cells), XXXp<0.001 (vs. TGF-β1-stimulated cells). BD illustrate the representative flow cytometry curves of non-GO-exposed control cells (red lines; BD), TGF-β1-exposed cells (purple line; B), TNF-α-exposed cells (green line; C), and TGF-1β + TNF-α-exposed cells (blue line; D). In separate experiments (n=4; independently performed), GO-induced lysosomal rupture was assessed in the presence of DFO or absence of DFO (E). In these experiments, cells were loaded with DFO (or not) immediately prior to GO exposure (2 mM DFO for 4 h). (F) AO-induced green fluorescence reflecting leakage from lysosomes was assessed following treatments as indicated before (open symbols) and after (symbols in black) GO exposure. A549 cells were exposed (or not) as indicated. Cytofluorometric analysis was performed before and after oxidative stress for 60 min by a stable physiological concentration of H2O2. Values are expressed as means ± 1 SD, n=4 (independently performed). §§p<0.01 and §§p<0.01 (vs. non-GO-exposed cells). *p<0.05, **p<0.01, Xp<0.05, XXp<0.01. Abbreviations: AO, acridine orange; DFO, dextran-bound deferoxamine; GO, glucose oxidase; SD, standard deviation; TGF, transforming growth factor; TNF-α, tumor necrosis factor-α.
Figure 5
Figure 5
(A) Representative Western blot and (B) summary of densitometric analysis of autophagosome formation in TGF-β1-stimulated cells treated as indicated. A549 cells were exposed (or not) for 72 h to nonlethal concentrations of TGF-β1 (10 ng/mL) ± 3-MA (2 mM), NAC (5 mM), DFO (0.1 mM), CQ (10 μM), or Baf (10 nM). Values are expressed as means ± 1 SD, n=3–7 (independently performed), *p<0.05 (vs. TGF-β1-exposed control cells). Control cells were set to 1 A.U., and corresponding controls (not treated with TGF-β1) were all ≤1 A.U. (data not shown). (C) Representative Western blots and (D and E) summaries of densitometric analysis of two representative markers of EMT, (D) vimentin and (E) N-cadherin, in A549 cultures treated as indicated. Values are expressed as means ± 1 SD, n=3–4 (independently performed), *p<0.05 (vs. TGF-β1-exposed control cells) **p<0.01. XXp<0.01, XXXp<0.001. Control cells were set to 1 A.U., and corresponding controls (not treated with TGF-1β) were all ≤1 A.U. (data not shown). Abbreviations: Baf, bafilomycin; CQ, chloroquine diphosphate salt; DFO, dextran-bound deferoxamine; EMT, epithelial–mesenchymal transition; GAPDH, glyceraldehyde-3- phosphate dehydrogenase; 3-MA, 3-methyladenine; NAC, N-acetyl-l-cysteine; SD, standard deviation; TGF, transforming growth factor; TNF-α, tumor necrosis factor-α.
Figure 6
Figure 6
A schematic figure illustrating the intimate link between TGF-β1-induced degradation of ferritin and lysosomal leakage. An extensive body of previous studies has demonstrated that TGF-β1 stimulation triggers EMT and oxidative stress. Similarly, a role for an enhanced autophagy, partly driven by oxidative cellular damage, is established in TGF-β1-induced EMT. Recently, Zhang et al demonstrated that TGF-β1-stimulation results in increased amounts of iron in the LIP, leading to ROS generation and EMT. The present study shows for the first time that increased degradation of ferritin inside lysosomes, which is upregulated by an enhanced autophagy, sensitizes the lysosomes to ROS, resulting in iron-driven oxidative injury upon lysosomal membranes. The resulting leakage of iron and harmful lysosomal content into the cytosol triggers further oxidative reactions, autophagy and EMT. Compared to TGF-β1-stimulated cultures, TNF-α-stimulated cultures display much less ROS and, yet, a significant loss of lysosomes. These observations cannot be explained unless protective mechanisms, working in TGF-β1-stimulated cells, counteract lysosomal leakage. Considering the recent finding that protection of damaged plasma membranes is afforded through lysosomal exocytosis, a similar protection of leaky lysosomes by the fusion with a great number of autophagosomes (1–3) is proposed, which thereby may seal the damaged parts of the lysosomal membranes (4,5). Abbreviations: EMT, epithelial–mesenchymal transition; LIP, labile iron pool; ROS, reactive oxygen species; TGF, transforming growth factor; TNF-α, tumor necrosis factor-α.

Similar articles

Cited by

References

    1. Willis BC, Borok Z. TGF-beta-induced EMT: mechanisms and implications for fibrotic lung disease. Am J Physiol Lung Cell Mol Physiol. 2007;293(3):L525–L534. - PubMed
    1. Nowrin K, Sohal SS, Peterson G, Patel R, Walters EH. Epithelial-mesenchymal transition as a fundamental underlying pathogenic process in COPD airways: fibrosis, remodeling and cancer. Expert Rev Respir Med. 2014;8(5):547–559. - PubMed
    1. Cannito S, Novo E, di Bonzo LV, Busletta C, Colombatto S, Parola M. Epithelial-mesenchymal transition: from molecular mechanisms, redox regulation to implications in human health and disease. Antioxid Redox Signal. 2010;12(12):1383–1430. - PubMed
    1. Liu R-M, Gaston Pravia KA. Oxidative stress and glutathione in TGF-β-mediated fibrogenesis. Free Radic Biol Med. 2010;48(1):1–15. - PMC - PubMed
    1. Arsalane K, Dubois CM, Muanza T, et al. Transforming growth factor-beta1 is a potent inhibitor of glutathione synthesis in the lung epithelial cell line A549: transcriptional effect on the GSH rate-limiting enzyme gamma-glutamylcysteine synthetase. Am J Respir Cell Mol Biol. 1997;17(5):599–607. - PubMed