

Production parameters and pig production cost: temporal evolution 2010-2014
- PMID: 28405437
- PMCID: PMC5382395
- DOI: 10.1186/s40813-016-0027-0
Production parameters and pig production cost: temporal evolution 2010-2014
Abstract
Background: The assessment of the cost of production and the relative weight of the different production parameters is very important in pig farming. The goals of the present work were 1) to describe reliable reference values for production parameters and pig production cost from 2010 to 2014, 2) to describe their temporal evolution and 3) to determine the influence of the pig company size on them. Between 61 and 107 pig production companies from Spain were included in this study from 2010 to 2014. These companies sent data on feed consumption, number of pig produced, expenses and census every month. Sip consultors SL standardized collected data and calculate cost and production parameters to obtain values comparables between the different pig production companies. The collected data each month were merged to obtain a yearly average value taking into account the pig production flow each month. A suitable statistical analysis was carried out to tackle the goals.
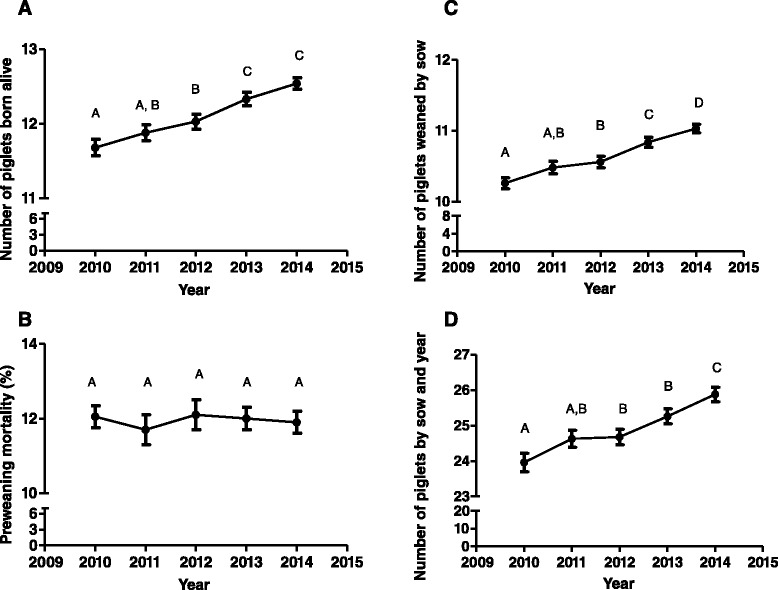
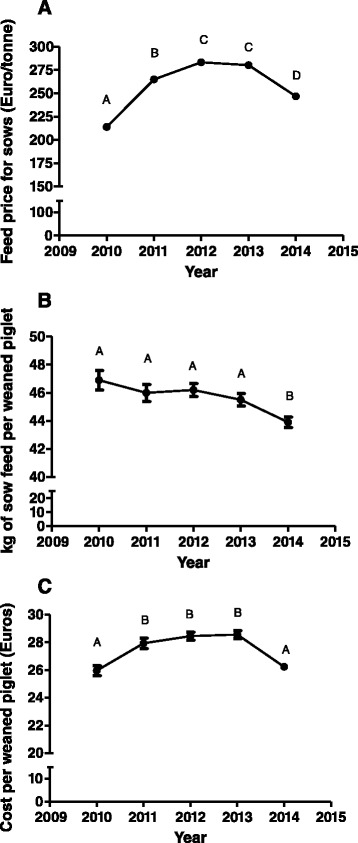
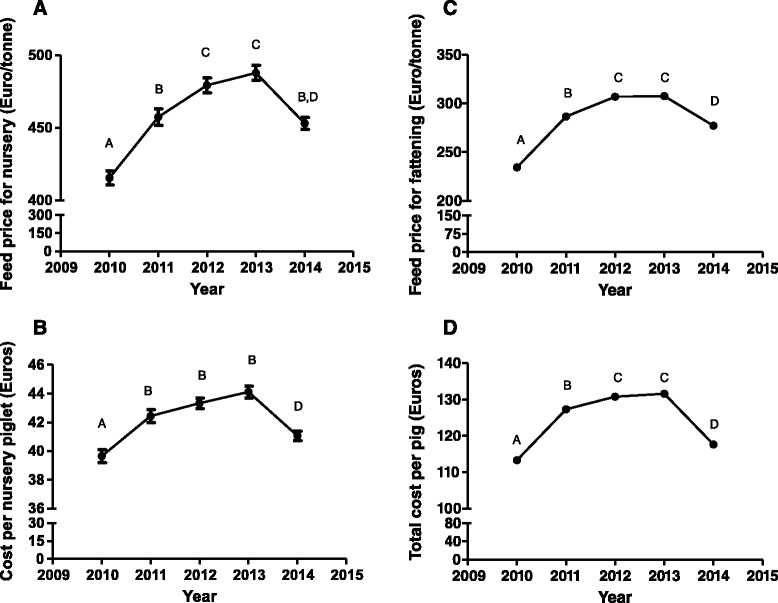
Results: The production performance has been continuously improving in the piglet production and fattening phase from 2010 to 2014. Thus, the number of piglets by sow and year will increase 0.5 pigs by year and the total feed conversion rate will decrease approximately 0.03 kg feed/kg gain by year in the future if the same tendency continues. However, feed price has been steadily increasing from 2010 to 2012 and decreasing afterwards and the total cost per kilogram produced has followed a similar pattern. This result highlights the relevance of the feed price in the final cost in spite of continuous improvement in production performance across years. Finally, pig company size affected most of the production parameters studied. Thus, the best technical parameters were obtained for companies with less than 5000 sows. However, the opposite tendency is observed for feed price where the highest value was observed for the smallest companies.
Conclusions: Pig production parameters have generally improved in the last five years but this improvement did not directly imply a reduction in pig production cost due to the high feed prices during the period 2010-2013.
Keywords: Company size; Cost; Evolution; Parameter production; Pig.
Figures


References
-
- Faostat 2013. http://faostat3.fao.org/home/E. Accessed 11th September 2014.
-
- De Lange FM, Dewey C. In: Management of growing-finishing pigs, chapter 6, Disease of swine. 9. Straw BE, Zimmerman J, D’Allaire S, Taylor DJ, editors. Ames, IA: Blackwell Publishing; 2009.
-
- Holden P. Swine costs and production. Agri-practice. 1991;12:46–8.
LinkOut - more resources
Full Text Sources
Other Literature Sources
Miscellaneous
