. 2017 Jan 6;6(3):e1278099.
doi: 10.1080/2162402X.2016.1278099. eCollection 2017.

Zoledronate can induce colorectal cancer microenvironment expressing BTN3A1 to stimulate effector γδ T cells with antitumor activity

Affiliations

Zoledronate can induce colorectal cancer microenvironment expressing BTN3A1 to stimulate effector γδ T cells with antitumor activity

Maria Raffaella Zocchi et al. Oncoimmunology. .

Abstract

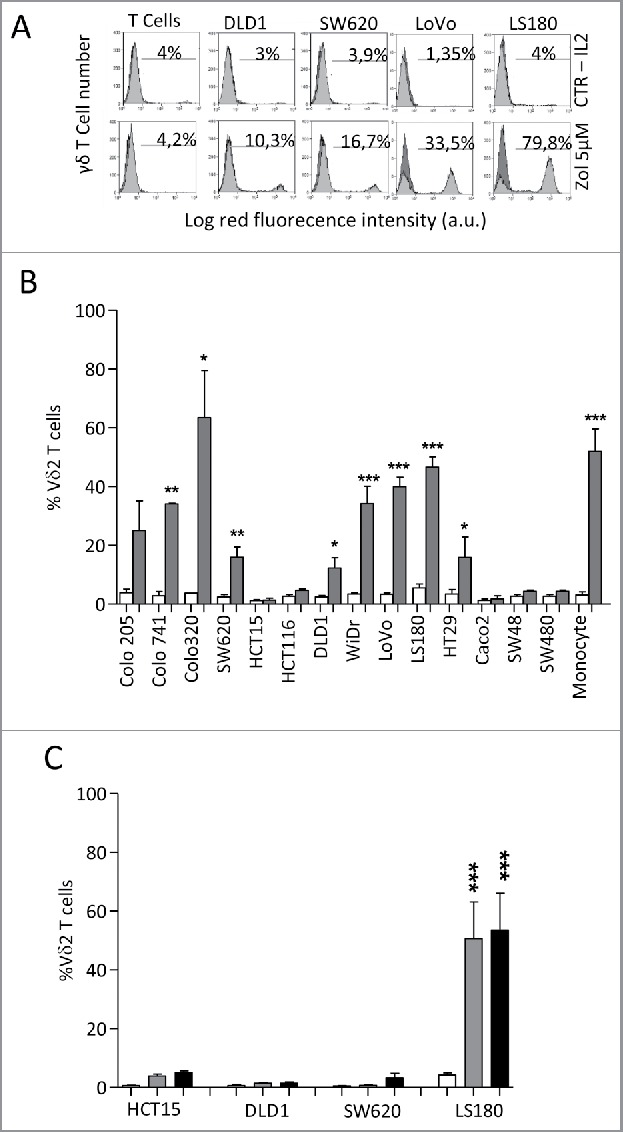
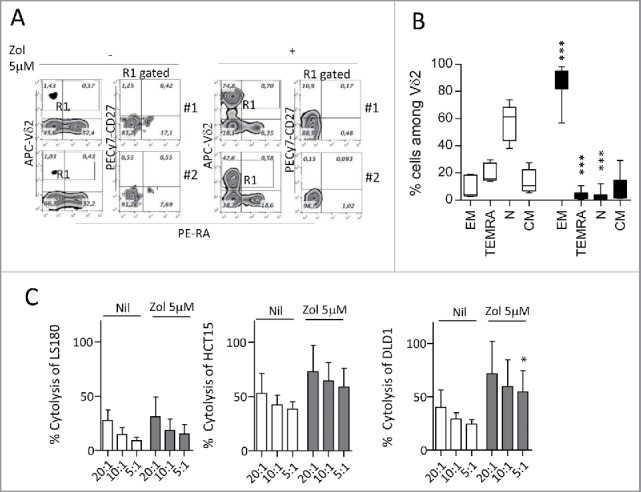
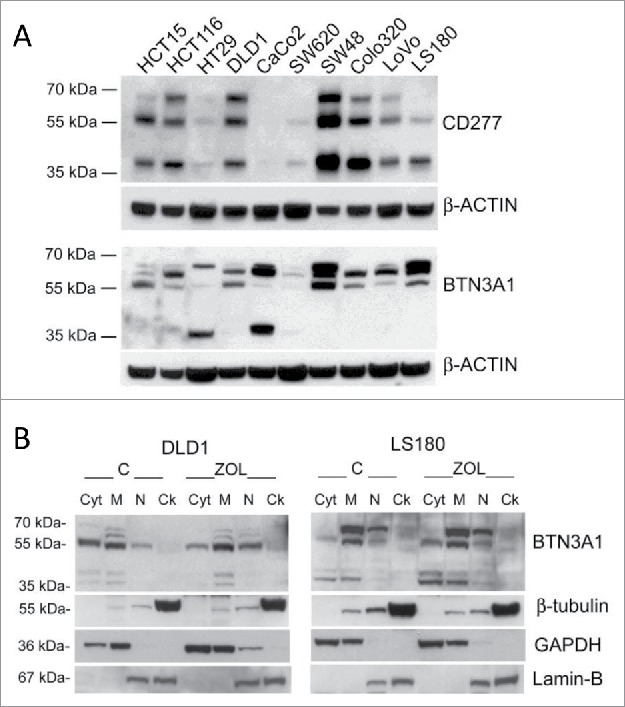
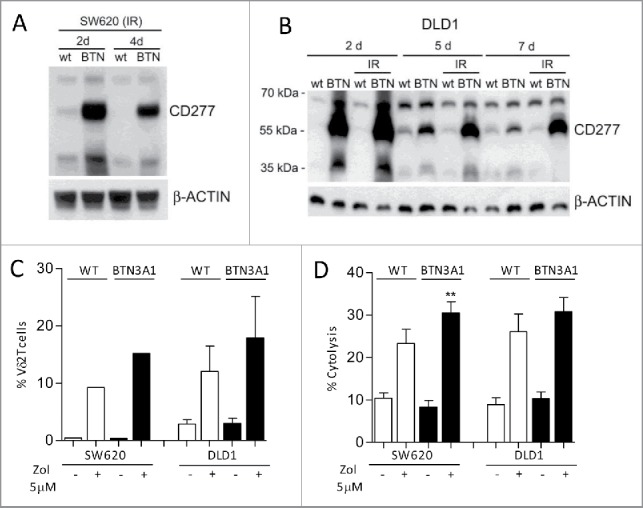
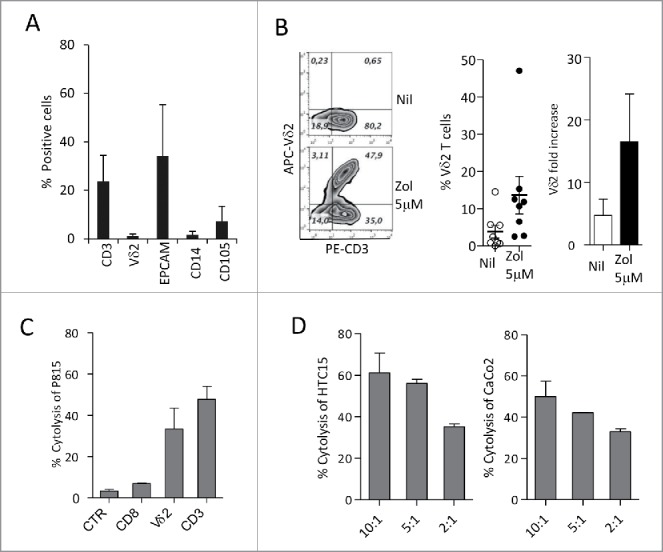
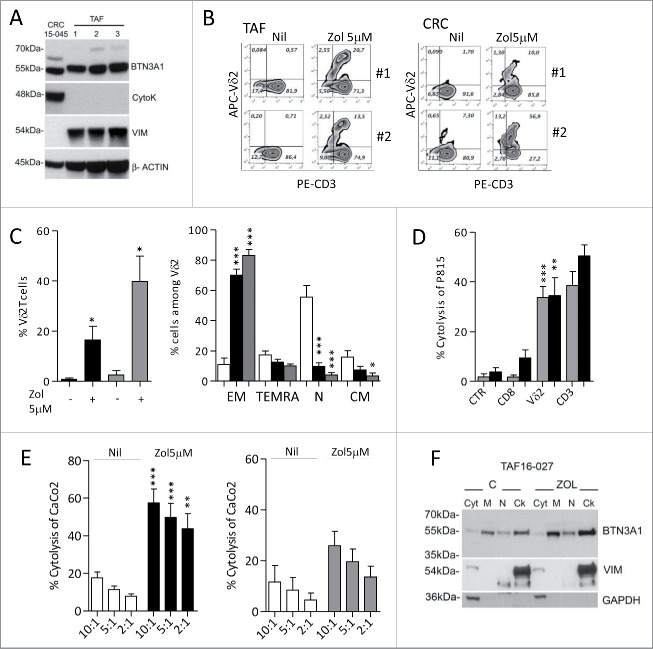
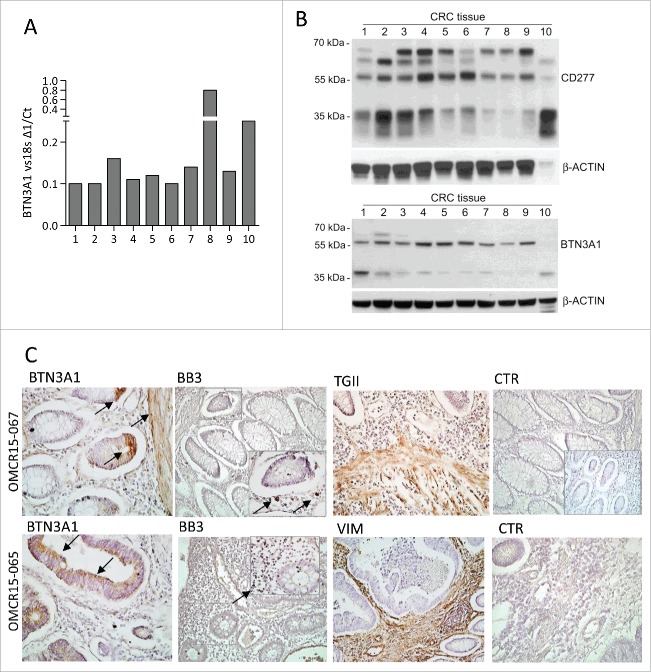
Amino-bis-phosphonates (N-BPs) such as zoledronate (Zol) have been used in anticancer clinical trials due to their ability to upregulate pyrophosphate accumulation promoting antitumor Vγ9Vδ2 T cells. The butyrophilin 3A (BTN3A, CD277) family, mainly the BTN3A1 isoform, has emerged as an important structure contributing to Vγ9Vδ2 T cells stimulation. It has been demonstrated that the B30.2 domain of BTN3A1 can bind phosphoantigens (PAg) and drive the activation of Vγ9Vδ2 T cells through conformational changes of the extracellular domains. Moreover, BTN3A1 binding to the cytoskeleton, and its consequent membrane stabilization, is crucial to stimulate the PAg-induced tumor cell reactivity by human Vγ9Vδ2 T cells. Aim of this study was to investigate the relevance of BTN3A1 in N-BPs-induced antitumor response in colorectal cancer (CRC) and the cell types involved in the tumor microenvironment. In this paper, we show that (i) CRC, exposed to Zol, stimulates the expansion of Vδ2 T lymphocytes with effector memory phenotype and antitumor cytotoxic activity, besides sensitizing cancer cells to γδ T cell-mediated cytotoxicity; (ii) this effect is partially related to BTN3A1 expression and in particular with its cellular re-distribution in the membrane and cytoskeleton-associated fraction; (iii) BTN3A1 is detected in CRC at the tumor site, both on epithelial cells and on tumor-associated fibroblasts (TAF), close to areas infiltrated by Vδ2 T lymphocytes; (iv) Zol is effective in stimulating antitumor effector Vδ2 T cells from ex-vivo CRC cell suspensions; and (v) both CRC cells and TAF can be primed by Zol to trigger Vδ2 T cells.

Keywords: Amino-bis-phosphonates; butyrophilin; colorectal cancer; immunostimulation; phosphate antigens.


Figures

Figure 1.
Figure 1.
Vδ2 T cell expansion upon co-culture with CRC exposed to Zol.The CRC cell lines HT29, HCT15, HCT116, SW48, SW620, SW480,Colo741, Colo205, Colo320, CaCo2, LS180, WiDr, LoVo and DLD1were co-cultured for 20 d with peripheral blood T cells from healthy donors, at the T:CRC ratio of 10:1, with 5 µM Zol and IL2 or IL2 alone. (A) percentage of Vδ2 T lymphocytes among one representative T cell population cultured alone (left histograms) and after co-culture with CRC (other panels, four representative CRC cell lines) with Zol (lower row) or IL2 alone (upper row) evaluated with the anti-Vδ2 mAb and FACS analysis. Data are represented as percentage of Vδ2 T cells (light gray histograms) reported in each quadrant. (B) percentage of Vδ2 T lymphocytes after 20 d of co-culture with the indicated CRC cell lines with Zol (gray columns) or IL2 alone (white columns). Data are the mean ± SD from six experiments for each cell line. *p <0.05, **p <0.01, ***p <0.001 vs. co-cultures without Zol. (C) SW620, HCT15, DLD1 and LS180 CRC cell lines were pre-treated (4 h) with high doses (100 µM, black bars, or 50 µM, gray bars) of Zol, washed and co-cultured with purified T cells as above, and evaluated for the percentage of Vδ2 T lymphocytes after 20 d of co-culture. Mean ± SD from six experiments with T cells of six different donors. ***p <0.001 vs. co-cultures without Zol (white bars).
Figure 2.
Figure 2.
Expansion of effector memory antitumor Vδ2 T cell lymphocytes upon co-culture with Zol-treated LS180 CRC cell line. Panels A and B: Peripheral blood T lymphocytes were co-cultured for 20 d with LS180 CRC cell line, in the absence or presence of Zol (5 µM) and IL2. (A) Representative phenotype of Vδ2 T cells from two donors (donor 1, upper plots, donor 2, lower plots), co-cultured with LS180 and IL2 alone or with Zol-treated LS180, stained with APC-anti Vδ2, PE-anti-CD27 and PE-Cy7-anti-CD45RA. (B) Results expressed as percentage of effector memory (EM, CD45RACD27) T cells, terminal-differentiated effector memory (TEMRA,CD45RA+-CD27) T cells, naive (N, CD45RA+CD27+) T cells or central memory (CM, CD45RACD27+) among Vδ2 T lymphocytes immediately after separation (white bars) or on day 20 of co-culture with LS180 cells (black bars). Mean ± SD from eight experiments. ***p <0.001 versus T lymphocytes after separation (white bars). (C): Vδ2 T cells derived from co-cultures with Zol-treated LS180 CRC cells were tested in a 4 h 51Cr release assay against untreated (white bars) or Zol-treated (5 µM for 24 h, gray bars) LS180 (left histogram) HCT15 (central histogram) or DLD1 (right histogram) cell lines at the E:T ratio of 20:1, 10:1 and 5:1. Results are expressed as percentage specific lysis, calculated as described in Materials and Methods, the mean ± SD from three experiments is shown. *p <0.05 vs. Nil.
Figure 3.
Figure 3.
BTN3A1 expression and subcellular localization in CRC cell lines. (A) BTN3A1 was evaluated in CRC cell lines by western blot. Immunoblot of cell lysates obtained from the indicated CRC cell lines as described in Materials and Methods, was probed with the anti-CD277 mAb (upper blot), or with a rabbit polyclonal anti-BTN3A1 antiserum (lower blot). β-actin was used as a loading control. (B) BTN3A1 localization in subcellular fractions (Cyt: cytosolic fraction, M: membrane-enriched fraction, N: nuclear fraction, Ck: cytoskeleton-enriched fraction) obtained with the Qproteome cell compartment kit from untreated o Zol-treated (10 µM for 24 h) DLD1 (left panel) or LS180 (right panel), as indicated. In each panel: β-tubulin as marker of Ck fractions, GAPDH for the Cyt/M fractions, lamin B for the N fraction.
Figure 4.
Figure 4.
Enhancement of BTN3A1 expression and expansion of antitumor Vδ2 T cells. SW620 (A, C, D) or DLDL1 (B, C, D) cells were transfected with BTN3A1-containing plasmid and irradiated to avoid the overgrowth of untransfected cells; expression was evaluated on day 2, 5 and 7 by western blot using the anti-CD277 (A, B). (C) Wild type (WT, white columns) or BTN3A1-transfected (black columns) SW620 or DLD1 cells, untreated or treated with Zol (5 µM), as indicated were co-cultured with purified T lymphocytes: the percentage of Vδ2 T cells was evaluated by immunofluorescence with the specific anti-Vδ2 mAb and FACS analysis after 20 d of culture; results are expressed as percentage Vδ2 T lymphocytes and are the mean ± SEM from three transfection experiments with six different T cell donors for DLD1; one representative experiment with two T cell donors for SW620. (D) WT (white columns) or BTN3A1-tranfected (black columns) SW620 or DLD1 cells, untreated or treated with Zol (5 µM) as indicated, were used as targets in a 4 h 51Cr release assay using as effectors IL-2-activated peripheral blood Vδ2 T cells at the E:T ratio of 10:1. Results are expressed as percentage specific lysis, calculated as described in Materials and Methods, and are the mean ± SEM from three experiments.**p <0.01 vs. Zol-treated WT SW620.
Figure 5.
Figure 5.
Measurement of IPP produced by SW620, DLD1 or LS180 CRC cell lines upon exposure to Zol. Acetonitrile extracts from LS180 (A), DLD1 (B) and SW620 cells (C) untreated (d) or treated with 5 µM Zol for 24 h (a), or 50 µM (b) and 100 µM (c) Zol for 4 h and maintained in culture for additional 20 h, were analyzed by HPLC/TOF-MS. The relative abundance of the extracted ion current (EIC) (m/z 244.99 [M-H]-) for IPP/DMAPP (3,3-dimethylallyl pyrophosphate) is shown. LS180 cells were also exposed to 5 µM Zol for 4 h (A, a1), to test early effects of low-dose Zol, giving no appreciable increase of IPP over controls. Quantification of IPP produced upon exposure to either 5 µM Zol for 24 h (Aa, Ba, Ca) or 100 µM Zol for 4 h (Ac, Bc, Cc) in the indicated CRC cell lines. Data are shown as IPP pmol/mg of total pmol extracted by ACN/total protein content in cell lysates after ACN extraction.
Figure 6.
Figure 6.
Differentiation of Vδ2 T cells from ex-vivo CRC cell suspensions. (A) Cell suspensions from CRC were stained with specific anti-CD3, anti-Vδ2, anti-EPCAM, anti-CD14 and anti-CD105 mAbs followed by aAPC-conjugated anti-isotype antiserum and analyzed by flow cytometry. Percentages of positive cells were calculated and results expressed as mean ± SD (n = 10). (B) CRC cell suspensions were cultured in the presence or absence of Zol (5 µM) and IL2 for 20 d, double stained with the specific PE-anti-CD3 and APC-antiVδ2 mAbs and the percentage of positive cells was calculated. Left plots: one representative experiment out of eight. Central histogram: percentage of Vδ2 T cells obtained from CRC cultures without (white) or with Zol (5 µM, black); mean ± SEM of eight experiments. Right histogram: results analyzed as fold increase (percentage of Vδ2 T cells on day 20 vs. day 0, white bar IL2 alone, black bar 5 µM Zol). Mean ± SEM (n = 8). (C and D) Vδ2 T cells obtained from 20 d of CRC cultures, with Zol, were used in re-directed killing assay against the P815 cell line in the presence of the anti-CD8, anti-Vδ2, anti-CD3 mAbs or an unrelated mAb matched for the isotype (CTR) (C) at the E:T ratio of 5:1, or in a 4 h 51Cr release cytolytic assay against the HCT15 or CaCo2 cell lines (D, left and right histograms) at the E:T ratio of 10:1, 5:1 and 2:1. One representative experiment of three is shown. Mean ± SEM of sample duplicate.
Figure 7.
Figure 7.
Differentiation of effector memory antitumor Vδ2 T cells induced by tumor-associated fibroblast (TAF) and tumor-derived CRC primary cultures. (A) Immunoblot of cell lysates obtained from three TAF (TAF16–020, TAF16–027 and TAF16–030) or the CRC15–045 epithelial cell primary culture, with polyclonal anti-BTN3A1 antiserum, anti-cytokeratin and anti-vimentin mAbs. β-actin is shown as a loading control. (B) Peripheral blood T lymphocytes were co-cultured with TAF (left plots: T cells from donor 1 and donor 2 upon culture on TAF16–020) or CRC15–045 epithelial cell culture (right plots, T cells from donor 1 and donor 2), pre-treated with Zol (5 µM) or not (Nil) for 20 d and double stained with PE-anti-CD3 and APC-anti-Vδ2mAbs. The percentage of Vδ2 T cells is reported in the upper right quadrant of each plot. (C) Left histogram: percentage of Vδ2 T cells obtained from 20 d of co-culture with untreated or Zol-treated TAF (black) or untreated or Zol-treated CRC15–045 and CRC13–011 epithelial cells (gray). Mean ± SEM (n = 8 experiments performed with two T lymphocyte donors and four TAF; n = 4 experiments with two T lymphocyte donors and the two CRC epithelial cells). Right histograms: percentage of effector memory (EM, CD45RACD27), terminal-differentiated effector memory (TEMRA,CD45RA+-CD27), naive (N, CD45RA+CD27+) or central memory (CM,CD45RACD27+) cells among Vδ2 cells from T lymphocytes immediately after separation (white bars) or on day 20 of co-culture with Zol-treated TAF cells (black bars) or CRC15–045 and CRC13–011 epithelial cells (gray bars). Mean ± SEM as above. ***p <0.001 or **p <0.01 or *p <0.05 vs. T lymphocytes after separation (white bars). (D, E) Vδ2 T cells obtained from T lymphocytes after 20 d of co-culture with Zol-treated TAF or CRC epithelial cells were used in re-directed killing assay against the P815 cell line in the presence of anti-CD8, anti-Vδ2, anti-CD3 mAbs or an unrelated mAb matched for the isotype as a control (CTR) at the E:T ratio of 5:1 (D: black columns: Vδ2 T cells from TAF co-cultures; gray columns: Vδ2 cells from CRC epithelial cell co-cultures), or in a 4 h 51Cr release cytolytic assay (E, left histogram, black columns: Vδ2 T cells from TAF co-cultures; right histogram, gray columns: Vδ2 cells from CRC epithelial cell co-cultures), against untreated (white columns) or Zol-treated (black or gray columns) CaCo2 cell line at the E:T ratio of 10:1, 5:1 and 2:1. Results are expressed as percentage specific lysis calculated as described in Materials and Methods. Mean ± SD from four experiments (left histogram) or two experiments (right histogram), ***p <0.001 or **p <0.01 Zol-treated vs. untreated CaCo2 cell line. (F) BTN3A1 localization in subcellular fractions (Cyt: cytosolic fraction, M: membrane-enriched fraction, N: nuclear fraction, Ck: cytoskeleton-enriched fraction) obtained with the Qproteome cell compartment kit from untreated or Zol-treated TAF16–027 (TAF2 in panel A). Vimentin was used as marker of the Ck fraction and GAPDH for the Cyt/M fractions.
Figure 8.
Figure 8.
BTN3A1 expression in CRC tissue specimens. BTN3A1 expression was evaluated in CRC tissue sections by Q-RT-PCR (A), western blot (B) or immunohistochemistry (C). (A) RNA was extracted from tissue sections of 10 CRC specimens, reverse transcribed and Q-RT-PCR for BTN3A1 performed. Results are expressed as1/ΔCt normalized to 18s. (B) immunoblots of lysates obtained from the indicated CRC tissue specimens, as described in Materials and Methods, with the anti-CD277 mAb (upper blot) or with a rabbit polyclonal anti-BTN3A1 antiserum (lower blot). β-actin is shown as a loading control. (C) immunohistochemistry of two representative cases out of the 10 indicated in panels A and B, performed as described in Materials and Methods, with the indicated antibodies: polyclonal rabbit anti-BTN3A1 antiserum (arrows), anti-Vδ2 mAb (BB3, arrows in the inset), polyclonal rabbit anti-TGII antiserum, anti-vimentin mAb and a matched isotype-unrelated antibody as negative control (goat anti-rabbit antiserum in the inset of the upper CTR). Slides were counterstained with hematoxylin, coverslipped with Eukitt and analyzed under a Leica DM MB2 microscope with a charged-coupled device camera (Olympus DP70) at a 40× enlargement, as indicated.

References

    1. Hayday AC. Gammadelta T cells and the lymphoid stress-surveillance response. Immunity 2009; 31(2):184-96; PMID:19699170; http://dx.doi.org/10.1016/j.immuni.2009.08.006 - DOI - PubMed
    1. Bonneville M, O'Brien RL, Born WK. Gammadelta T cell effector functions: a blend of innate programming and acquired plasticity. Nat Rev Immunol 2010; 10(7):467-78; PMID:20539306; http://dx.doi.org/10.1038/nri2781 - DOI - PubMed
    1. Poggi A, Zocchi MR. γδ T lymphocytes as a first line of immune defense: Old and new ways of antigen recognition and implications for cancer immunotherapy. Front Immunol 2014; 5:575; PMID:25426121; http://dx.doi.org/10.3389/fimmu.2014.00575 eCollection 2014; http://www.jem.org/cgi/doi/10.1084/jem.20021500 - DOI - DOI - PMC - PubMed
    1. Gober HJ, Kistowska M, Angman L, Jenö P, Mori L, De Libero G. Human T cell receptor gammadelta cells recognize endogenous mevalonate metabolites in tumor cells. J Exp Med 2003; 197(2):163-8; PMID:12538656; http://www.jem.org/cgi/doi/10.1084/jem.20021500 - DOI - PMC - PubMed
    1. Wang H, Sarikonda G, Puan KJ, Tanaka Y, Feng J, Giner JL, Cao R, Mönkkönen J, Oldfield E, Morita CT. Indirect stimulation of human Vγ2Vδ2 T cells through alterations in isoprenoid metabolism. J Immunol 2011; 187(10):5099-113; PMID:22013129; http://dx.doi.org/10.4049/jimmunol.1002697 - DOI - PMC - PubMed

Publication types

LinkOut - more resources