. 2017 Feb 17;6(3):e1290038.
doi: 10.1080/2162402X.2017.1290038. eCollection 2017.

Anti-VEGFR2-interferon-α2 regulates the tumor microenvironment and exhibits potent antitumor efficacy against colorectal cancer

Affiliations

Anti-VEGFR2-interferon-α2 regulates the tumor microenvironment and exhibits potent antitumor efficacy against colorectal cancer

Zhaoting Li et al. Oncoimmunology. .

Abstract

Interferon-α (IFNα) has multiple antitumor effects including direct antitumor toxicity and the ability to potently stimulate both innate and adaptive immunity. However, its clinical applications in the treatment of malignancies have been limited because of short half-life and serious adverse reactions when attempting to deliver therapeutically effective doses. To address these issues, we fused IFNα2a to the anti-vascular endothelial growth factor and receptor 2 (VEGFR2) antibody JZA00 with the goal of targeting it to the tumor microenvironment where it can stimulate the antitumor immune response. The fusion protein, JZA01, is effective against colorectal cancer by inhibiting angiogenesis, exhibiting direct cytotoxicity, and activating the antitumor immune response. Although JZA01 exhibited reduced IFNα2 activity in vitro compared with native IFNα2, VEGFR2 targeting permitted efficient antiproliferative, proapoptotic, antiangiogenesis, and immune-stimulating effects against the colorectal tumors HCT-116 and SW620. JZA01 showed in vivo efficacy in NOD-SCID mice-bearing established HCT-116 tumors. In conclusion, this study describes an antitumor immunotherapy that is highly promising for the treatment of colorectal cancer.

Keywords: CD8+ T cells; DCs; IFNα2; VEGFR2; colorectal cancer; tumor microenvironment.


Figures

Figure 1.
Figure 1.
Construction and characterization of JZA01. (A) Diagram of JZA01. IFNα2 was linked to the C-terminal of H′-chain of JZA00 with a G4S linker using overlap PCR yielding JZA01. (B) Western blot analysis of purified JZA01 with anti-kappa chain and anti-IFNα shows that it was properly assembled and was of the correct molecular weight. Lane 1: JZA00 non-reducing; Lane 2: JZA01 non-reducing; Lane 3: JZA00 reducing; Lane 4: JZA01 reducing. JZA01 and JZA00 were purified using protein A affinity chromatography and the purity was identified with (C) non-reducing SDS-PAGE and (D) reducing SDS-PAGE; Lane 1: JZA01; Lane 2: JZA00.
Figure 2.
Figure 2.
JZA01 binds to KDR and to cells expressing VEGFR2. (A) The binding affinity of JZA01 with KDR was determined with the Biacore system. To prepare chips, JZA01 was captured on a CM5 chips with bound anti-human IgG. Increasing concentrations of the KDR (from bottom to top) ranging from 0.78125 nM to 100 nM then flowed over the chip for 120 s. Binding affinity was calculated using the 2:1 model. (B) Binding affinity of JZA00 with KDR was determined as described in (A) with concentrations of KDR ranging from 0.78125 nM to 100 nM. (C) L02 cells or (D) HUVEC were incubated with 100 nM JZA00 or JZA01 for 1 h, washed three times with PBS, and then incubated with FITC labeled anti-human kappa chain and analyzed by flow cytometry assay. (E) Western blot analysis of VEGFR2 expression using either JZA01 or JZA00 as the primary antibody and HRP-conjugated goat-anti-human IgG H+L (Sino Biological Inc., China) as the secondary antibody. Lane 1: JZA01 HUVEC; Lane 2: JZA01 HCT-116; Lane 3: JZA00 HCT-116; Lane 4: JZA01 SW620; Lane 5: JZA00 SW620.
Figure 3.
Figure 3.
JZA01 inhibits the proliferation, migration, transwell invasion, and tube formation of HUVECs. (A) HUVECs were incubated with different concentrations of JZA01, JZA00, or IFNα and proliferation analyzed by MTT assay. Inhibition (%) was calculated as (1 − ODexperiment/ODcontrol) × 100%. (B) and (D) The inhibition of the migration of HUVECs by JZA01 added at different concentrations was analyzed by the scratch assay. The distance of migration at 0 h, 12 h, 16 h, 20 h, 24 h was measured using Image-Pro Plus 6.0 after being photographed by an inverted OLYMPUS microscope at 100× magnification. Inhibition (%) = (1 − lengthexperiment/lengthcontrol) × 100%. (C) and (E) Photomicrographs and quantitative analysis of transwell invasion assay indicated that JZA01 suppressed the invasion of HUVECs better than IFNα or JZA00 in a dose-dependent manner. Inhibition (%) = [(control – experiment)/ control] ×100%. (F) and (G) HUVECs were incubated for 4 h with different concentrations of the JZA00, JZA01, or IFNα in a 96-well plate pretreated with matrigel. The endothelial tubes were photographed by an inverted OLYMPUS microscope at 100× magnification with the number of endothelial tubes counted using Image-Pro Plus 6.0. Inhibition (%) = (1 − numberexperiment/numbercontrol) × 100%. Quantitative analysis were presented as the mean ± SD, n = 5, *p < 0.05, **p < 0.01, ***p < 0.001.
Figure 4.
Figure 4.
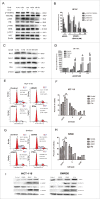
JZA01 inhibits the proliferation, colony formation, and promotes apoptosis of HCT-116 and SW620. (A) HCT-116 or (B) SW620 cells were incubated with different concentrations of JZA00, JZA01, or IFNα for 72 h and proliferation were quantified by MTT assay. Inhibition (%) = (1 − ODexperiment/ODcontrol) × 100%. (C) and (D) HCT-116 or (E) and (F) SW620 cells were diluted to 1000 /mL and incubated in 6-well plates with JZA00, JZA01, or IFNα at 50 nM for 7 d. The numbers of colonies formation was measured by Image-Pro Plus 6.0. Inhibition (%) = (1 − numberexperiment/numbercontrol) × 100%. Quantitative analysis is presented as the mean ± SD, n = 5, *p < 0.05, **p < 0.01, ***p < 0.001. (G) HCT-116 and (I) SW620 cells were incubated with JZA00 100 nM, JZA01 100 nM, or IFNα 200 nM for 48 h and analyzed by flow cytometry following staining with PtdIns and Annexin V. (H) and (J) Annexin V positive cells in Q2 and Q3 were considered apoptotic and are shown quantitatively as the mean ± SD, n = 3, *p < 0.05, **p < 0.01, ***p < 0.001.
Figure 5.
Figure 5.
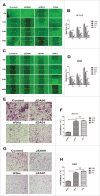
JZA01 inhibits the migration and invasion of HCT-116 and SW620. For the scratch test, (A) HCT-116 or (C) SW620 cells were incubated in 24-well plates with JZA00, JZA01, or IFNα and photographed at 0 h, 12 h, 24 h, and 48 h. (B) and (D) The migration lengths were measured by Image-Pro Plus 6.0 and data were presented as the mean ± SD, n = 3, *p < 0.05, **p < 0.01, ***p < 0.001. Photomicrographs and quantitative analysis of transwell invasion assay indicated that JZA01 suppressed the invasion of HCT-116 (E) and (F) and SW620 (G) and (H) cells in a dose-dependent manner. % Inhibition = [(control – experiment)/ control] ×100%. Data were presented as the mean ± SD, n = 5, *p < 0.05, **p < 0.01, ***p < 0.001.
Figure 6.
Figure 6.
JZA01 downregulates VEGFR2, STAT, and apoptosis signaling pathways and causes cell cycle arrest of colorectal cancer cells. (A) Western blot analysis for p-VEGFR2/VEGFR2, p-P38/P38, p-ERK/ERK, and p-AKT/AKT in HUVECs treated with different concentrations of JZA01 for 48 h. (B) Gray scanning and data statistics of (A) based on the integrated density of β-actin. (C) Western blot analysis of Bcl2 family proteins in HUVECs treated with different concentrations of JZA01 for 48 h. (D) Gray scanning and data statistics of (C) based on the integrated density of 0 nM. (E) and (F) Cell cycle analysis by flow cytometry of HCT-116 (E) and (F) or SW620 (G) and (H) cells that incubated with JZA00, JZA01, or IFNα for 48 h. Data were presented as the mean ± SD, n = 3, *p < 0.05, **p < 0.01, ***p < 0.001. (I) Western blot analysis of STAT activation in HCT-116 and SW620 following treatment with JZA01 (100 nM) for 30 min.
Figure 7.
Figure 7.
JZA01 treatment enhances DCs maturation and activity. (A) Flow cytometry assay of the expression of MHC class I of HCT-116 under different treatments (JZA00 50 nM, JZA01 50 nM, and IFNα 100 nM) for 48 h. (B) Flow cytometry assay of the expression of MHC class I of SW620 under different treatments (JZA00 50 nM, JZA01 50 nM, and IFNα 100 nM) for 48 h. (C), (D), and (E) Immature dendritic cells were isolated from non-activated huPBMCs and incubated under different treatments of 72 h. The expression of CD80, CD86, and MHC class I were detected by the flow cytometry assay. (F) CD8+ T cells labeled with CFSE were co-cultured for 48 h with DCs (10:1) pretreated with different treatments in (C) and isolated using human CD8+ T cells isolation kit (BD Bioscience;557766) before detected by flow cytometry assay. (G) and (H) CD8+ T cells together with DCs (10:1, in (F)) as effectors, E:T ratio 1:1, 5:1, 10:1, time point of 24 h, Abs 50 nM, IFNα 100 nM, cytotoxicity% were analyzed by LDH release assay. Data were presented as mean of three repeats. % Cytotoxicity = [(experimental − effector spontaneous − target spontaneous)/(target maximum − target spontaneous)]×100. (G) represents the cytotoxicity% of HCT-116, < (H) represented the cytotoxicity % of SW620. (I) and (J) CD8+ T cells together with DCs (10:1, in (F)) as effectors, E:T ratio 10:1, time point of 24 h, Abs 50 nM, IFNα 100 nM, the production of IFNγ was measured by ELISA kit. (I) HCT-116 as target cells; (J) SW620 as target cells.
Figure 8.
Figure 8.
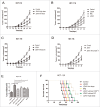
JZA01 has superior antitumor efficacy in HCT-116-bearing NOD-SCID mice. (A) and (B) Female NOD-SCID mice 4–6 weeks of age (n = 6 per group) were injected in the left armpit with 5 × 10⁶ HCT-116 cells and 1 × 10⁷ unstimulated huPBMC. (A) Mice was treated with 1 mg/kg (high dose) or 0.5 mg/kg (low dose) JZA01 (i.v.) twice a week with tumor growth followed for a month. (B) Mice were treated with 1 mg/kg of JZA01 or JZA00, or IFNα (200 μg/kg) twice a week and tumor volumes were monitored for a month. (C) and (D) Female NOD-SCID mice 4–6 weeks of age were injected in the left armpit each with 5 × 10⁶ HCT-116 cells and 1 × 10⁷ unstimulated huPBMC from which dendritic cells (C) or CD8+ T cells (D) had been removed. Mice (n = 6 per group) were treated with 1 mg/kg JZA01 twice a week (i.v.) beginning from day 0 for a month with tumor volumes monitored. (E) Tumor inhibition of different dosage groups. JZA01 high dose significantly improved tumor inhibition compared with other groups. Data represent the mean ± SD (n = 6 per group). *p < 0.05, **p < 0.01, ***p < 0.001. (F) The survival of tumor-bearing NOD-SCID mice for 100 d. Data are from the experiments shown in panels A-D. The JZA01-treated group had better survival compared with IFNα-treated group. Log-rank tests: JZA01 high dose versus JZA00, p < 0.001; JZA01 high dose versus JZA01 low dose, p = 0.0012; JZA01 high dose versus IFNα2, p < 0.001; JZA01 high dose versus JZA01 without DCs, p = 0.0409; JZA01 high dose versus JZA01 without CD8+ T, p = 0.0080.
Figure 9.
Figure 9.
JZA01 inhibits the HCT-116 tumor growth at least in part through influencing the tumor microenvironment in vivo. (A) CD31+ blood vessels were identified with an anti-CD31 antibody (brown staining). Photomicrographs show representative pictures from three independent tumor samples. (B) Semiquantitative and statistical analysis of CD31+ blood vessels. The CD31 density was calculated with Image Pro Plus. Relative expression of CD31 (%) = (Experiment/Control) ×100%. (C) Expression of Ki-67 in paraffin sections of xenografted tumor identified with an anti-Ki-67 antibody (brown staining). (D) The tumor cells expressing Ki-67 were counted with Image-Pro-Plus. Ki-67 positive (%) = (cell expressing Ki-67/total cells)×100%. (E) Staining of VEGF using anti-VEGF (brown staining). (F) Semiquantitative and statistical analysis of VEGF. (G) Expression of HIF-1α identified by anti-HIF-1α (brown staining). JZA01 was more effective in downregulating the expression of HIF-1α and VEGF than IFNα or JZA00. (H) Semiquantitative and statistical analysis of HIF-1α. VEGF and HIF-1α density were quantified with Image-Pro-Plus. Relative expression (%) = (Experiment/Control) ×100%. (I) The infiltration of CD8+ T cells was identified with an anti-CD8+ antibody (brown staining). (J) Semiquantitative and statistical analysis of the infiltration of CD8+ T cells. The relative number of CD8+ T cells was calculated with Image-Pro-Plus. (K) Expression of IFNγ in the tumor microenvironment was identified by staining with anti-IFNγ (red fluorescence) following different treatments. Expression of IFNγ in JZA01 group is the highest. All pictures were photographed by an inverted OLYMPUS microscope at 400× magnification. (L) Semiquantitative and statistical analysis of IFNγ expression made with Image-Pro-Plus. Relative expression (%) = (Experiment/Control) ×100%.

Similar articles

Cited by

References

    1. Spill F, Reynolds DS, Kamm RD, Zaman MH. Impact of the physical microenvironment on tumor progression and metastasis. Curr Opin Biotechnol 2016; 40:41-8; PMID:26938687; http://dx.doi.org/ 10.1016/j.copbio.2016.02.007 - DOI - PMC - PubMed
    1. Joyce JA, Fearon DT. T cell exclusion, immune privilege, and the tumor microenvironment. Science 2015; 348(6230):74-80; PMID:25838376; http://dx.doi.org/ 10.1126/science.aaa6204 - DOI - PubMed
    1. Pittet MJ. Behavior of immune players in the tumor microenvironment. Curr Opin Oncol 2009; 21(1):53-9; PMID:19125019; http://dx.doi.org/ 10.1097/CCO.0b013e32831bc38a - DOI - PMC - PubMed
    1. Buchbinder EI, McDermott DF. Interferon, interleukin-2, and other cytokines. Hematol Oncol Clin North Am 2014; 28(3):571-83; PMID:24880948; http://dx.doi.org/ 10.1016/j.hoc.2014.02.001 - DOI - PubMed
    1. Borden EC, Sen GC, Uze G, Silverman RH, Ransohoff RM, Foster GR, Stark GR. Interferons at age 50: past, current and future impact on biomedicine. Nat Rev Drug Discov 2007; 6(12):975-90; PMID:18049472; http://dx.doi.org/ 10.1038/nrd2422 - DOI - PMC - PubMed

Publication types

LinkOut - more resources