

Long-term follow-up of a randomized AAV2- GAD gene therapy trial for Parkinson's disease
- PMID: 28405611
- PMCID: PMC5374069
- DOI: 10.1172/jci.insight.90133
Long-term follow-up of a randomized AAV2- GAD gene therapy trial for Parkinson's disease
Abstract
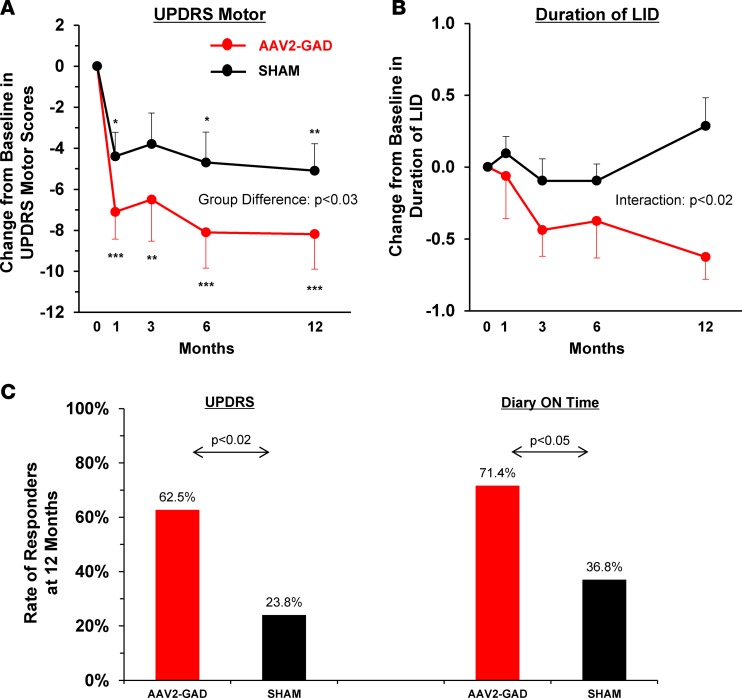
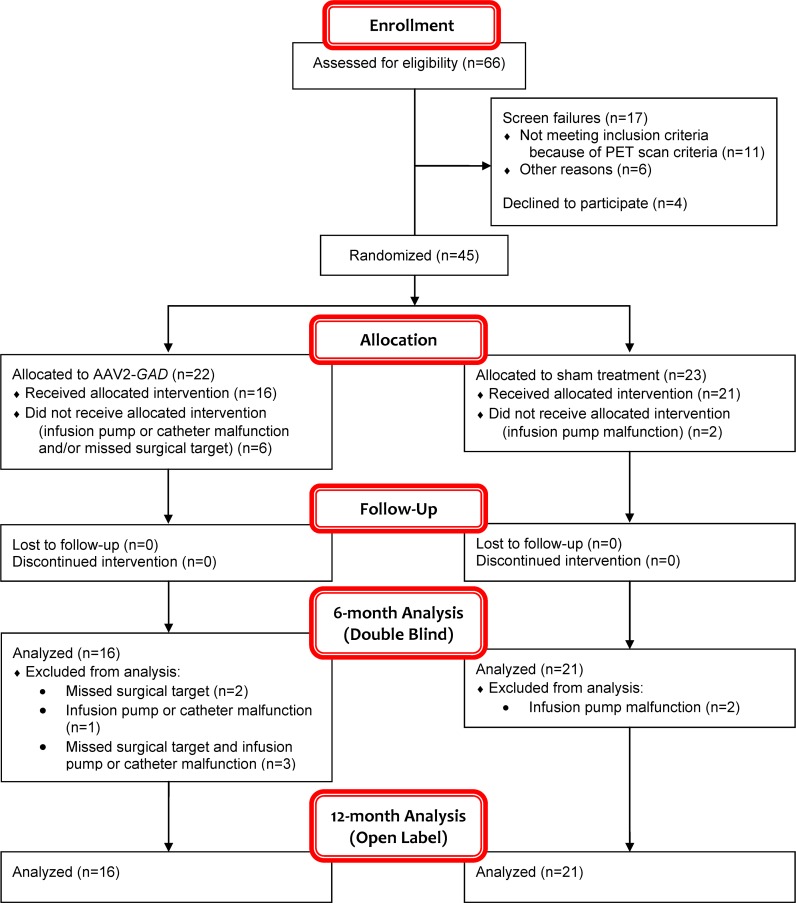
BACKGROUND. We report the 12-month clinical and imaging data on the effects of bilateral delivery of the glutamic acid decarboxylase gene into the subthalamic nuclei (STN) of advanced Parkinson's disease (PD) patients. METHODS. 45 PD patients were enrolled in a 6-month double-blind randomized trial of bilateral AAV2-GAD delivery into the STN compared with sham surgery and were followed for 12 months in open-label fashion. Subjects were assessed with clinical outcome measures and 18F-fluorodeoxyglucose (FDG) PET imaging. RESULTS. Improvements under the blind in Unified Parkinson's Disease Rating Scale (UPDRS) motor scores in the AAV2-GAD group compared with the sham group continued at 12 months [time effect: F(4,138) = 11.55, P < 0.001; group effect: F(1,35) = 5.45, P < 0.03; repeated-measures ANOVA (RMANOVA)]. Daily duration of levodopa-induced dyskinesias significantly declined at 12 months in the AAV2-GAD group (P = 0.03; post-hoc Bonferroni test), while the sham group was unchanged. Analysis of all FDG PET images over 12 months revealed significant metabolic declines (P < 0.001; statistical parametric mapping RMANOVA) in the thalamus, striatum, and prefrontal, anterior cingulate, and orbitofrontal cortices in the AAV2-GAD group compared with the sham group. Across all time points, changes in regional metabolism differed for the two groups in all areas, with significant declines only in the AAV2-GAD group (P < 0.005; post-hoc Bonferroni tests). Furthermore, baseline metabolism in the prefrontal cortex (PFC) correlated with changes in motor UPDRS scores; the higher the baseline PFC metabolism, the better the clinical outcome. CONCLUSION. These findings show that clinical benefits after gene therapy with STN AAV2-GAD in PD patients persist at 12 months. TRIAL REGISTRATION. ClinicalTrials.gov NCT00643890. FUNDING. Neurologix Inc.
Conflict of interest statement
Conflict of interest: C.C. Tang, P.A. Le Witt, M.A. Leehey, S.G. Ojemann, A.W. Flaherty, S.K. Kostyk, M.S. Siddiqui, S.B. Tatter, J.M. Schwalb, K.L. Poston, I.H. Richard, M.J. During, and M.G. Kaplitt have received funding from funding from Neurologix Inc. M.J. During and M.G. Kaplitt are coinventors on the patent re: Glutamic acid decarboxylase (GAD) based delivery systems (United States Patent No. 7,695,959 B2). D. Eidelberg is a coinventor on the patents re: Markers for use in screening patients for nervous system dysfunction and a method and apparatus for using same (United States Patent No. 5,632,276 and No. 5,873,823). Additional COI information is reported in the supplemental materials.
Figures


Similar articles
-
AAV2-GAD gene therapy for advanced Parkinson's disease: a double-blind, sham-surgery controlled, randomised trial.Lancet Neurol. 2011 Apr;10(4):309-19. doi: 10.1016/S1474-4422(11)70039-4. Lancet Neurol. 2011. PMID: 21419704 Clinical Trial.
-
Safety and tolerability of gene therapy with an adeno-associated virus (AAV) borne GAD gene for Parkinson's disease: an open label, phase I trial.Lancet. 2007 Jun 23;369(9579):2097-105. doi: 10.1016/S0140-6736(07)60982-9. Lancet. 2007. PMID: 17586305 Clinical Trial.
-
Subthalamic GAD gene transfer in Parkinson disease patients who are candidates for deep brain stimulation.Hum Gene Ther. 2001 Aug 10;12(12):1589-91. Hum Gene Ther. 2001. PMID: 11529246 Clinical Trial.
-
Gene-targeting approaches for movement disorders: recent advances.Curr Opin Neurol. 2019 Aug;32(4):566-570. doi: 10.1097/WCO.0000000000000719. Curr Opin Neurol. 2019. PMID: 31232714 Review.
-
AAV-GAD gene for rat models of neuropathic pain and Parkinson's disease.Acta Neurochir Suppl. 2008;101:99-105. doi: 10.1007/978-3-211-78205-7_17. Acta Neurochir Suppl. 2008. PMID: 18642642 Review.
Cited by
-
Gene therapy for polygenic or complex diseases.Biomark Res. 2024 Sep 4;12(1):99. doi: 10.1186/s40364-024-00618-5. Biomark Res. 2024. PMID: 39232780 Free PMC article. Review.
-
Bidirectional regulation of motor circuits using magnetogenetic gene therapy.Sci Adv. 2024 Oct 11;10(41):eadp9150. doi: 10.1126/sciadv.adp9150. Epub 2024 Oct 9. Sci Adv. 2024. PMID: 39383230 Free PMC article.
-
Longitudinal network changes and phenoconversion risk in isolated REM sleep behavior disorder.Nat Commun. 2024 Dec 30;15(1):10797. doi: 10.1038/s41467-024-54695-z. Nat Commun. 2024. PMID: 39737936 Free PMC article.
-
Personalized Medicine in Parkinson's Disease: New Options for Advanced Treatments.J Pers Med. 2021 Jul 10;11(7):650. doi: 10.3390/jpm11070650. J Pers Med. 2021. PMID: 34357117 Free PMC article. Review.
-
Parkinson's Disease Drug Therapies in the Clinical Trial Pipeline: 2021 Update.J Parkinsons Dis. 2021;11(3):891-903. doi: 10.3233/JPD-219006. J Parkinsons Dis. 2021. PMID: 34151864 Free PMC article. Review.
References
Publication types
MeSH terms
Substances
Supplementary concepts
Associated data
LinkOut - more resources
Full Text Sources
Other Literature Sources
Medical
Miscellaneous
