. 2017 Apr 6;2(7):e91634.
doi: 10.1172/jci.insight.91634.

LipidFinder: A computational workflow for discovery of lipids identifies eicosanoid-phosphoinositides in platelets

Affiliations

LipidFinder: A computational workflow for discovery of lipids identifies eicosanoid-phosphoinositides in platelets

Anne O'Connor et al. JCI Insight. .

Abstract

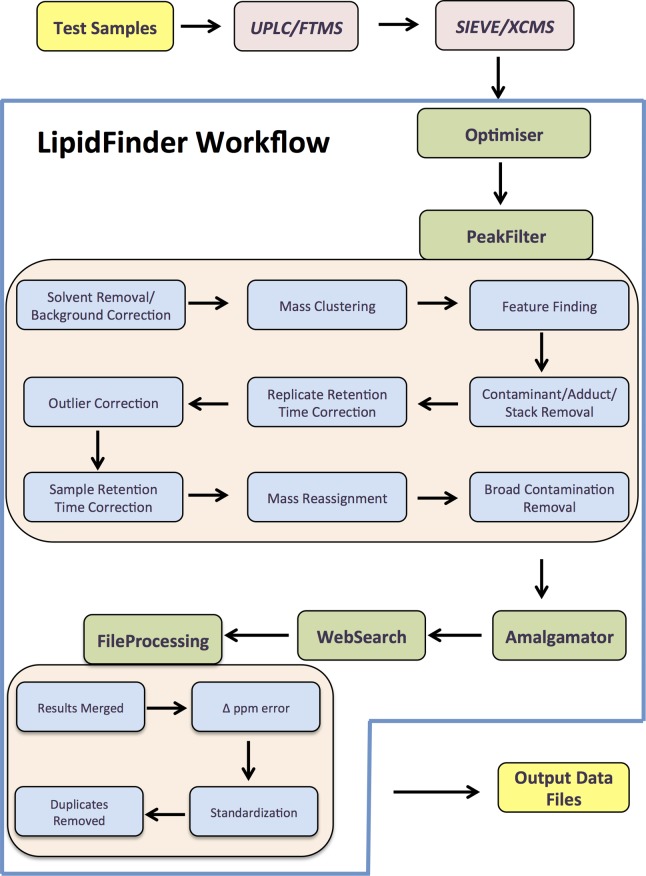
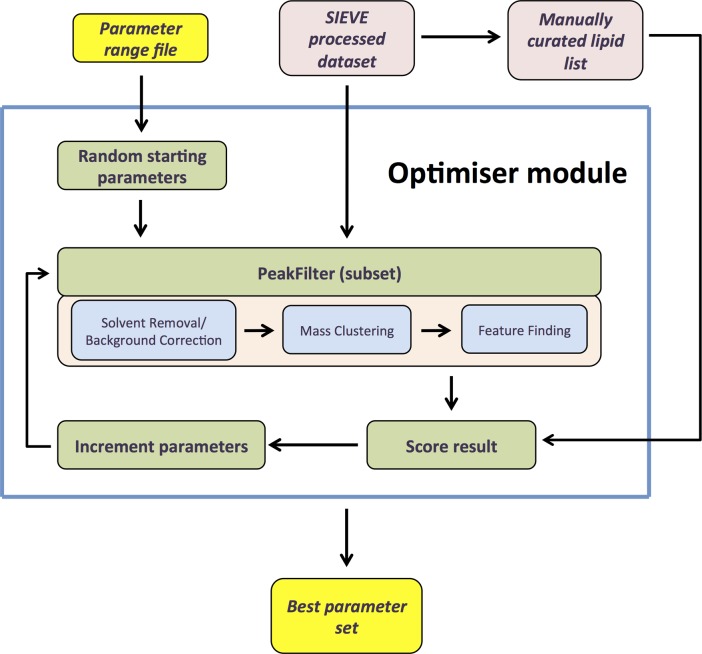
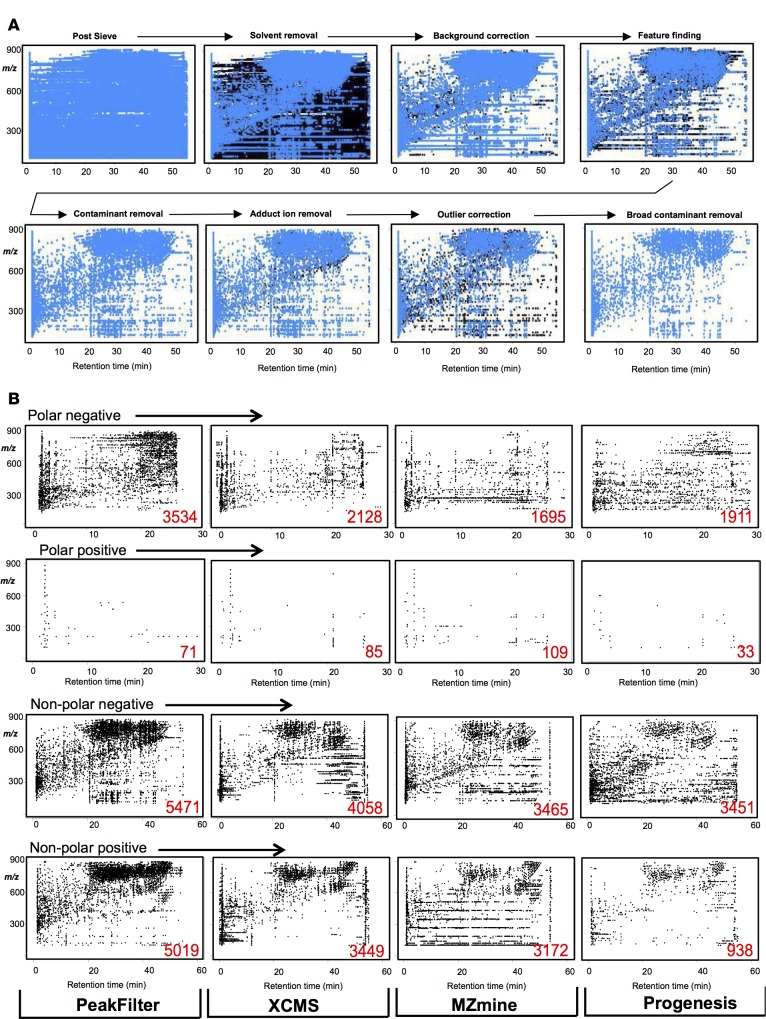
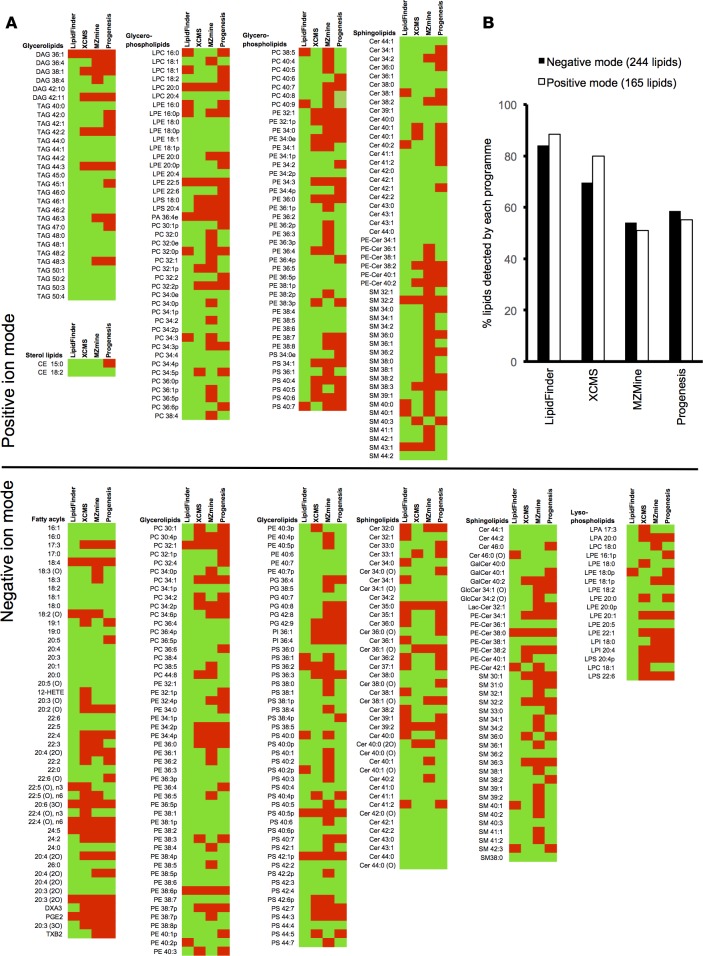
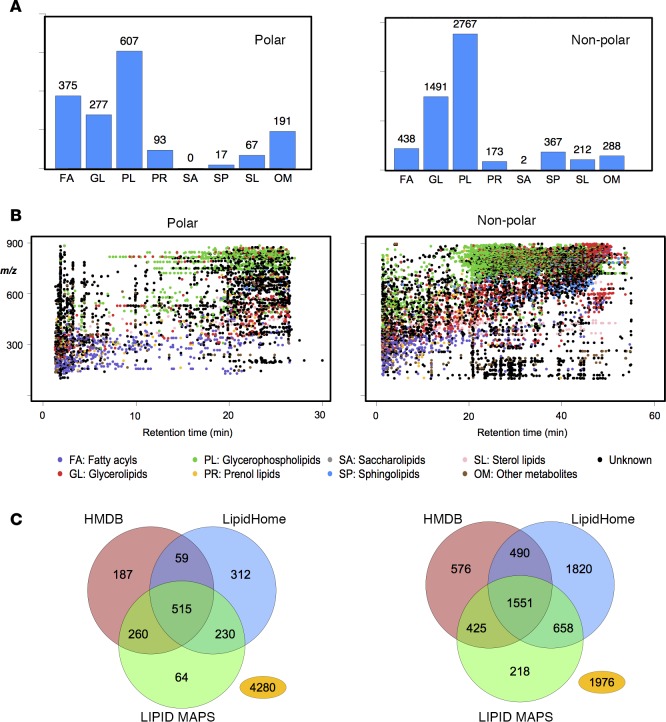
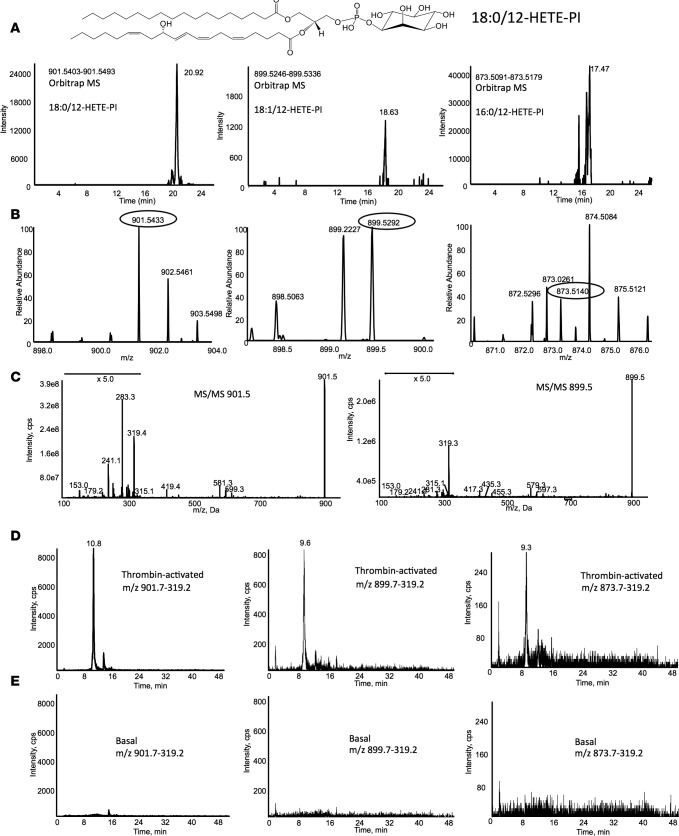
Accurate and high-quality curation of lipidomic datasets generated from plasma, cells, or tissues is becoming essential for cell biology investigations and biomarker discovery for personalized medicine. However, a major challenge lies in removing artifacts otherwise mistakenly interpreted as real lipids from large mass spectrometry files (>60 K features), while retaining genuine ions in the dataset. This requires powerful informatics tools; however, available workflows have not been tailored specifically for lipidomics, particularly discovery research. We designed LipidFinder, an open-source Python workflow. An algorithm is included that optimizes analysis based on users' own data, and outputs are screened against online databases and categorized into LIPID MAPS classes. LipidFinder outperformed three widely used metabolomics packages using data from human platelets. We show a family of three 12-hydroxyeicosatetraenoic acid phosphoinositides (16:0/, 18:1/, 18:0/12-HETE-PI) generated by thrombin-activated platelets, indicating crosstalk between eicosanoid and phosphoinositide pathways in human cells. The software is available on GitHub (https://github.com/cjbrasher/LipidFinder), with full userguides.


Conflict of interest statement

Conflict of interest: The authors have declared that no conflict of interest exists.

Figures

Figure 1
Figure 1. Schematic of the LipidFinder data processing workflow (using SIEVE).
Data is first analyzed using UPLC/FTMS, and SIEVE is then fed into the LipidFinder workflow, which incorporates Optimiser, PeakFilter, Amalgamator, WebSearch, and FileProcessing. Data files that retain m/z, peak area, retention time, and putative identifications are outputted at the end.
Figure 2
Figure 2. Overview of Optimiser.
A range file (max and min list) is inputted, and the module then chooses random starting parameters. These are inputted and tested, then rescored using Optimiser’s PeakFilter functionality, until further changes do not produce improvement in peak detection (RT, m/z, and intensity). The process uses a representative subset of lipids that has been manually curated from raw data.
Figure 3
Figure 3. Detection of a list of putatively identified positively and negatively charged lipids by LipidFinder and three commonly used processing packages.
(A) Table of reference lipids identified by lipid species and category and whether they were detected (green)/undetected (red) by each of the four programs. A series of platelet lipids was manually verified to be present in the Orbitrap dataset, using Xcalibur, and then interrogated for detection using each of the programs, as shown. (B) Bar chart summary of A results. Data shows the % of lipids in positive/negative ion mode detected by each program, calculated from A.
Figure 4
Figure 4. Demonstration of LipidFinder analysis of a dataset of platelet lipids and comparison of performance between LipidFinder and three commonly used metabolomics processing packages.
(A) Sequential cleanup steps implemented in PeakFilter, after Optimiser parameter setting show removal of large numbers of artifact ions. Scatter diagrams of the PeakFilter output after a selection of steps in the workflow for one sample in nonpolar negative ionization mode. Blue dots indicate m/z ions remaining from current step; black dots indicate m/z ions from previous step. (B) Scatter diagrams of the final outputs from each of the four programs tested, showing the elution of lipids from polar or nonpolar columns, in either negative or positive ionization mode. Red values in bottom right of plots indicate the total lipids plotted. Note the numerous horizontal groups of artifact ions visible in nonpolar negative plots for XCMS, MZmine, and Progenesis.
Figure 5
Figure 5. Putative identification of LipidFinder results and comparison of database searches.
(A) Bar charts showing predominant lipid molecular species in platelets are phospholipids. Each ion was classed using FileProcessing according to the most prevalent hits from three databases into LIPID MAPS categories. (B) Scatter diagrams of the LipidFinder output showing elution of lipids from polar or nonpolar columns, in either negative or positive ionization mode and color-coded by lipid category. (C) Venn diagrams showing the utility of using several databases for putative identifications. Distribution of hits across three different databases found using WebSearch is shown. The number in yellow represents the number of lipids not given any putative match. Computational and curated data from all databases was used.
Figure 6
Figure 6. MS identification of eicosanoid-phosphoinositide lipids generated by platelets.
(A) Orbitrap MS of HETE-PIs in platelet lipid extracts at 60,000 resolution (at m/z 400) showing elution of ions with m/z values corresponding to 18:0, 18:1, and 16:0/12-HETE-PIs. (B) MS of the putative HETE-PI ions. Single ions are shown at expected m/z values, circled, for the corresponding lipids in A. (C) MS/MS of the two most abundant HETE-PIs. Ions from 12-HETE (m/z 179, 319), PI headgroup (153,241, 315), and sn1 fatty acids (283 and 281 for 18:0 and 18:1, respectively) are seen. (D and E) LC/MS/MS separation of thrombin-activated (D) or basal (E) platelet lipid extracts monitoring MRM transitions corresponding to HETE-PEs. HETE-PIs are only detected following activation of platelets.

Similar articles

Cited by

References

    1. Hinterwirth H, Stegemann C, Mayr M. Lipidomics: quest for molecular lipid biomarkers in cardiovascular disease. Circ Cardiovasc Genet. 2014;7(6):941–954. doi: 10.1161/CIRCGENETICS.114.000550. - DOI - PubMed
    1. Wenk MR. The emerging field of lipidomics. Nat Rev Drug Discov. 2005;4(7):594–610. doi: 10.1038/nrd1776. - DOI - PubMed
    1. Oresic M, Hänninen VA, Vidal-Puig A. Lipidomics: a new window to biomedical frontiers. Trends Biotechnol. 2008;26(12):647–652. doi: 10.1016/j.tibtech.2008.09.001. - DOI - PubMed
    1. Han X. Neurolipidomics: challenges and developments. Front Biosci. 2007;12:2601–2615. doi: 10.2741/2258. - DOI - PMC - PubMed
    1. Kind T, Liu KH, Lee DY, DeFelice B, Meissen JK, Fiehn O. LipidBlast in silico tandem mass spectrometry database for lipid identification. Nat Methods. 2013;10(8):755–758. doi: 10.1038/nmeth.2551. - DOI - PMC - PubMed

Publication types