. 2017 Apr 6;2(7):e91868.
doi: 10.1172/jci.insight.91868.

M1-like monocytes are a major immunological determinant of severity in previously healthy adults with life-threatening influenza

Affiliations

M1-like monocytes are a major immunological determinant of severity in previously healthy adults with life-threatening influenza

Suzanne L Cole et al. JCI Insight. .

Abstract

In each influenza season, a distinct group of young, otherwise healthy individuals with no risk factors succumbs to life-threatening infection. To better understand the cause for this, we analyzed a broad range of immune responses in blood from a unique cohort of patients, comprising previously healthy individuals hospitalized with and without respiratory failure during one influenza season, and infected with one specific influenza A strain. This analysis was compared with similarly hospitalized influenza patients with known risk factors (total of n = 60 patients recruited). We found a sustained increase in a specific subset of proinflammatory monocytes, with high TNF-α expression and an M1-like phenotype (independent of viral titers), in these previously healthy patients with severe disease. The relationship between M1-like monocytes and immunopathology was strengthened using murine models of influenza, in which severe infection generated using different models (including the high-pathogenicity H5N1 strain) was also accompanied by high levels of circulating M1-like monocytes. Additionally, a raised M1/M2 macrophage ratio in the lungs was observed. These studies identify a specific subtype of monocytes as a modifiable immunological determinant of disease severity in this subgroup of severely ill, previously healthy patients, offering potential novel therapeutic avenues.


Conflict of interest statement

Conflict of interest: The authors have declared that no conflict of interest exists.

Figures
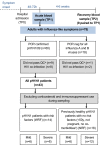
Figure 1
Figure 1. Flow chart of patient recruitment and grouping.
All patients with suspected influenza A virus (IAV) infection (influenza-like symptoms) were sampled at TP1. aTechnical quality control (QC) required that all samples were processed without any freeze-thaw cycles, all baseline “fluorescence minus one” FACS controls were present, and control fluorochromes were at the expected intensity on the day of acquisition. bComorbidities in the study were hematological malignancies, asthma, chronic obstructive pulmonary disease (COPD), diabetes mellitus, cardiac failure, ischemic heart disease, and cancers. Patients with hypertension were not excluded. TP, time point; WRF, with risk factors; NRF, no risk factors.
Figure 2
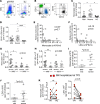
Figure 2. Sustained increase in monocyte levels in NRF patients with severe IAV infection.
(A) Typical flow cytometry size-granularity plots from a severe pH1N1 and an ILI patient demonstrating excess of large, granular immune cell populations (gates “a” and “b”) for IAV-infected patients. ILI, influenza-like illness but PCR negative for influenza virus. (B) Gate “a” from A was identified as CD15+CD14 low density granulocytes (LDG) and gate “b” comprised CD14+ (CD14mid–hi) monocytes. Gate “b” can further be divided into CD14hiCD16 classical monocytes: “i”; CD14hiCD16+ intermediate or inflammatory monocytes, “ii”; and CD14midCD16+ nonclassical or patrolling monocytes, “iii.” These gates were CD3. (C and D) Circulating CD14+ (i.e., CD14mid–hi) monocytes and CD15+ LDG expressed as absolute numbers of cells per ml of blood for all pH1N1 patients (n = 43; n = 17 mild, n = 26 severe) and healthy controls (n = 12). (E and F) Relationship between viral load at TP0 (see Table 1) and circulating monocytes and LDG for 41 of 43 pH1N1 patients (viral load unavailable for 2 patients). Viral load relative to each patient was expressed as “relative PFU equivalents” (see Methods). (G and H) Number of circulating CD14+ monocytes and CD15+ LDG for NRF (no risk factors; n = 18) and WRF (with risk factors; n = 14) patients. (I and J) Monocyte and LDG numbers for n = 5 severe and n = 5 mild NRF patients normalized for time from the first symptoms. These patients were sampled between 8 and 18 days from the first symptoms. (K) Monocyte and LDG numbers at TP1 (admission) and 4–6 weeks later (TP2) for n = 9 patients from the NRF severe group. Filled symbols refer to patients still hospitalized at TP2. r values and significance were calculated using Spearman’s rank test. All values are mean ± SEM for normally distributed sets and median ± interquartile range for nonnormal distribution. P values were calculated using Kruskal-Wallis test and Dunn’s multiple comparison test (C, D, G, and H); Mann-Whitney (I and J); and Wilcoxon matched-pairs signed rank test for TP1 versus TP2 (K). *P < 0.05; **P < 0.01; ****P < 0.0001. TP, time point; HC, healthy control.
Figure 3
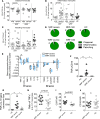
Figure 3. Monocytes in severe NRF patients are M1 like.
(AC) Classical, inflammatory, and patrolling monocytes in blood of mild and severe NRF and WRF patients. (D) Pie chart representation of classical, inflammatory, and patrolling monocyte frequencies in blood of NRF or WRF patients and healthy controls (HC) observed in A–C. Values refer to % of total monocytes. (E) Ex vivo expression of genes associated with M1 and M2 macrophage differentiation in CD14+ monocytes isolated from n = 10 NRF and n = 5 WRF patients with severe disease. Each gene is normalized to β-actin in the sample and then compared with the mean of the gene/β-actin of healthy controls (n = 9) (Mann-Whitney test with Bonferroni correction for multiple testing; ** adjusted P = 0.01). (F) TNF-α gene expression normalized to CD14 gene expression for each of the severe NRF and WRF patients and healthy controls. (E and F) Asterisks refer to statistically different genes comparing NRF severe and WRF sever. (G) TNF-α/IL-10 gene expression. (H) Ratio of TNF-α/IL-10 protein expression by intracellular cytokine staining. TNF-α and IL-10 expression (as cytokine-positive cells, as proportion of CD14+ monocytes) was measured following 6 hours of LPS stimulation of PBMCs. (I and J) Expression of M1 (CCR7 surface staining) and M2 (CD163 surface staining) markers on monocytes, measured by flow cytometry. P values were calculated using Kruskal-Wallis test and Dunn’s multiple comparison test for FG and Student’s t test if data were normally distributed and Mann-Whitney test if not for AD and HJ. *P < 0.05; **P < 0.01. NRF, no risk factors; WRF, with risk factors.
Figure 4
Figure 4. Increased circulating monocytes in severe IAV infection is matched by high levels of monocyte-derived macrophages in lungs but reduced resident alveolar macrophages.
(A) Appearance of lungs from day 4 of severe IAV infection (PR8) showing hemorrhagic areas. (B–G) Gating of monocytes and neutrophils in blood of mild and severe murine models: classical Ly6G+ neutrophils (i) and CCR2+Ly6ChiLy6G monocytes (ii) (equivalent to human CD14hi monocytes) on FACS plot of red cell–lysed blood on day 3 of mild (X-179A) and severe (PR8) IAV infection. Alveolar resident macrophages are CD11c+SiglecF+ and monocytes or MDMs in BAL are CCR2+. Populations of cells in BAL on day 3 after infection: Ly6CmidF4/80 neutrophils (i), Ly6ChiF4/80mid differentiating monocytes/monocyte-derived macrophages (MDM) (ii), and Ly6C F4/80hi resident alveolar macrophages (iii). Positive expression was defined against FMO samples to accommodate autofluorescence. (H and I). Alveolar macrophages (iii) express M2 markers, while monocytes/MDMs (ii) express M1 markers and are low in M2 expression. (J–L) Absolute numbers of monocytes and neutrophils in blood and monocytes/MDMs and neutrophils in BAL and lung digests on day 3 (D3) after infection with X-179A (mild) or PR8 (severe) and uninfected mice. Findings are from 2 experiments; n = 6 mice in total. Statistical comparison between monocytes and neutrophils in PR8 infection in JL was performed separately and showed higher levels of monocytes/MDMs in BAL and lung digests compared with neutrophils (Mann-Whitney). (M and N) Number of Siglec F+ alveolar resident macrophages on day 3 in BAL and lung digests of mice. Statistical significance measured using 1-way ANOVA with Tukey test. Horizontal lines and error bars represent mean ± SEM for normally distributed sets and median ± interquartile range for nonnormal distribution. *P < 0.05; **P < 0.01; ****P < 0.0001. BAL, bronchoalveolar lavage; FMO, fluorescence minus one controls; AM, alveolar macrophages.
Figure 5
Figure 5. Blood monocytes and lung monocyte/macrophages are M1 like.
(A–C) Number of M1 and M2 monocytes/MDMs on day 3 in blood, BAL, and lung digests. M1 monocytes were defined as CD86+Ly6Chi cells and M2 monocytes as CD206+Ly6Chi in appropriate gates from Figure 4, B–E. 2 experiments; n = 6 mice in total. (D and E) TNF-α production measured by flow cytometry intracellular cytokine staining after 6 hours of LPS in blood and ex vivo in lungs. Gated on Ly6Chi monocytes from blood. Statistical significance measured using 1-way ANOVA with Tukey test. Horizontal lines and error bars in graphs represent mean ± SEM for normally distributed sets and median ± interquartile range for nonnormal distribution. *P < 0.05; **P < 0.01; ****P < 0.0001. BAL, bronchoalveolar lavage; MDM, monocyte-derived macrophage.
Figure 6
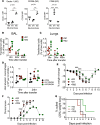
Figure 6. M2 macrophage transfer to lungs of infected mice improves disease outcome.
(A) M1 and M2 markers on bone marrow–derived macrophages (MØ) used for adoptive transfer. Graphs show mean ± SEM from n = 3 preparations of bone marrow pooled from 4–6 mice per preparation. (B and C) Number of transferred cells (identifiable as CD45.1+ cells) in BAL and lung digests of mice 6 and 24 hours after administration of M1 BMDMs (+M1) or M2 BMDMs (+M2). n = 6 mice per group; 2 separate experiments. (Absolute values are given in Supplemental Figure 6, D and E.) (D) Numbers of resident alveolar macrophages in host mice after M1 BMDM or M2 BMDM transfer. 2 experiments, total of 4–6 mice at each time point for BD. (E–G) Weight loss, clinical scores, and percentage of mice culled after adoptive transfer of M1, M2 BMDMs, or PBS. Clinical course was best in the M2-transferred group compared with PBS or M1 groups, with statistically significant findings on days 3 and 4. On day 4, mice that received M1 showed significantly worse clinical scores compared with those that received PBS and M2: clinical score 0, healthy; 1, calm but still exploring; 2, slow and exploring less; 3, hunched and shivery; 4, inactive; and 5, inactive even with handling. Total of n = 6 mice per group, 2 experiments. Differences among the 3 groups were analyzed using 2-way ANOVA with repeated measures. Comparisons were performed up to day 4 when all 3 groups still had equal numbers of mice. All P values for multiple comparisons were <0.001 except for clinical score on day 3, where the P value for M2 compared with M1 and PBS P < 0.05. For A and D, statistical significance was measured using 1-way ANOVA with Tukey test. *P < 0.05; **P < 0.01; ***P < 0.001. BMDM, bone marrow–derived macrophage.
Figure 7
Figure 7. Lungs from high-pathogenicity H5N1 infection are enriched for monocytes and M1 genes, with downregulation of M2 genes.
(A) Quantitative spider plot representation of the degree of enrichment of gene ontology (GO) terms for major immune cell subsets using the GOrilla online tool. Numbers represent enrichment scores. Granulocyte, regulation of granulocyte chemotaxis; Monocyte, regulation of monocyte chemotaxis; Macrophage, regulation of macrophage chemotaxis; B cell, regulation of B cell–mediated immunity; NK cell, regulation of NK cell–mediated immunity; T cell, positive regulation of α-β T cell activation. Days 3 and 5 refer to days after infection. (B and C) Expression of differentially regulated monocyte-attracting chemokines in lungs on days 3 and 5 after infection with H5N1 (black) or X179A (gray) relative to uninfected mice. (D and E) GSEA enrichment plots of M1 macrophage or M2 macrophage genes in lungs from H5N1- or X179A-infected mice on day 3, showing M1 enrichment of upregulated genes on day 3 for both H5N1 and X179A. This indicates an overrepresentation of M1 genes in both infections on day 3. In contrast, there was an underrepresentation of M2 genes in H5N1 but not X179A. This is one of 4 gene sets used to interrogate M1 and M2 gene enrichment (GSE51466) (all 4 are shown in Supplemental Figure 8). Enrichment score refers to the degree to which the gene set is overrepresented at the top or bottom of the ranked input list of genes. n = 3 mice per group for gene arrays. NES, normalized enrichment score (adjusted for gene set size or multiple hypothesis testing). Red bold or blue text indicates statistically significant enrichment of genes on day 3 after infection or in uninfected lungs, respectively.

References

    1. Influenza (Seasonal) Fact Sheet. World Health Organization. http://www.who.int/mediacentre/factsheets/fs211/en/ Updated November 2016. Accessed March 8, 2017.
    1. Novel Swine-Origin Influenza A (H1N1) Virus Investigation Team, et al. Emergence of a novel swine-origin influenza A (H1N1) virus in humans. N Engl J Med. 2009;360(25):2605–2615. doi: 10.1056/NEJMoa0903810. - DOI - PubMed
    1. Gómez-Gómez A, et al. Severe pneumonia associated with pandemic (H1N1) 2009 outbreak, San Luis Potosí, Mexico. Emerging Infect Dis. 2010;16(1):27–34. doi: 10.3201/eid1601.090941. - DOI - PMC - PubMed
    1. Louie JK, et al. Factors associated with death or hospitalization due to pandemic 2009 influenza A(H1N1) infection in California. JAMA. 2009;302(17):1896–1902. doi: 10.1001/jama.2009.1583. - DOI - PubMed
    1. La Gruta NL, Kedzierska K, Stambas J, Doherty PC. A question of self-preservation: immunopathology in influenza virus infection. Immunol Cell Biol. 2007;85(2):85–92. doi: 10.1038/sj.icb.7100026. - DOI - PubMed

Publication types

Substances