. 2017 Apr 13:8:14895.
doi: 10.1038/ncomms14895.

Rapid population decline in migratory shorebirds relying on Yellow Sea tidal mudflats as stopover sites

Affiliations

Rapid population decline in migratory shorebirds relying on Yellow Sea tidal mudflats as stopover sites

Colin E Studds et al. Nat Commun. .

Abstract

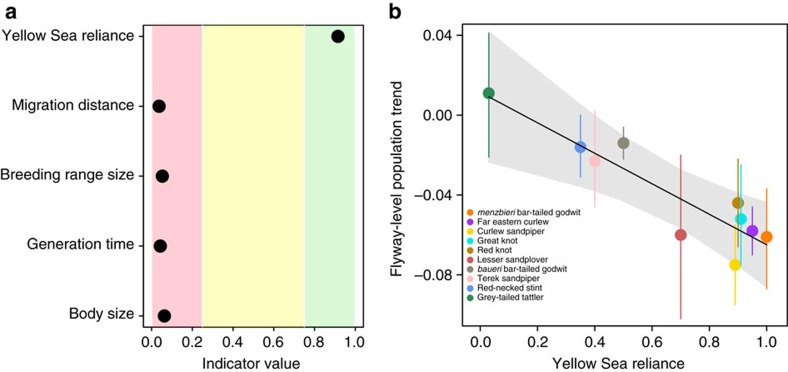
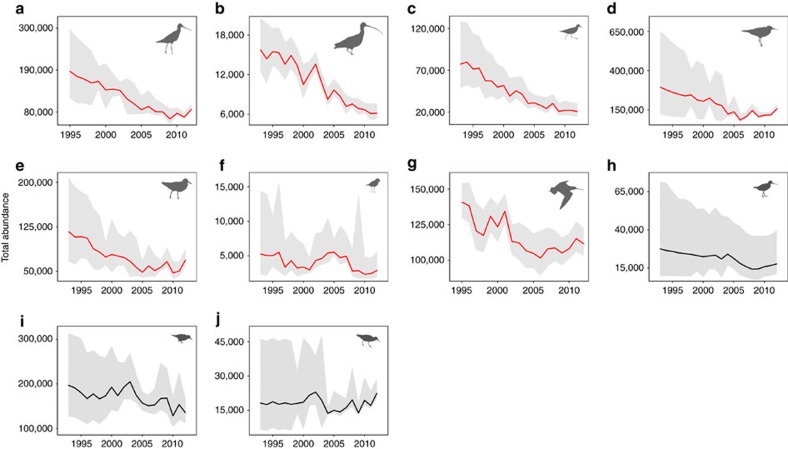
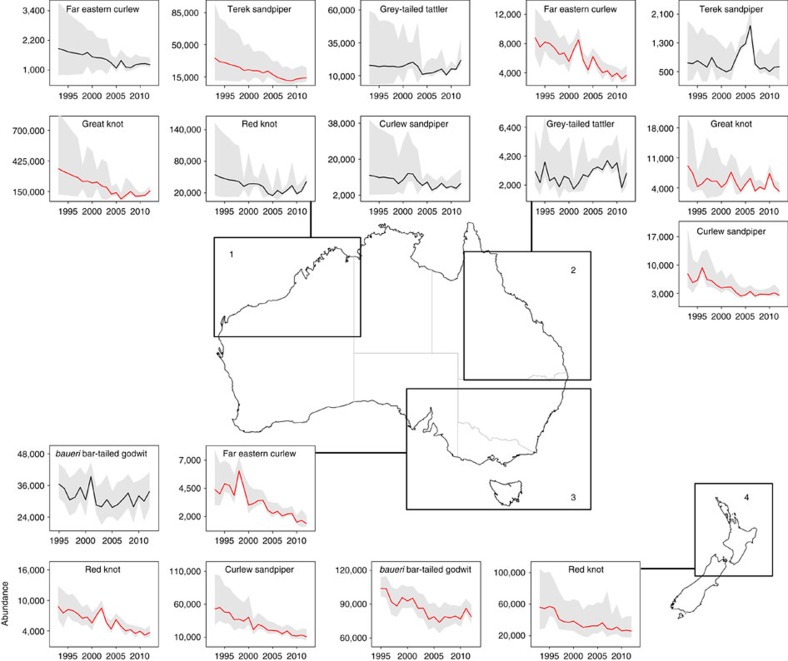
Migratory animals are threatened by human-induced global change. However, little is known about how stopover habitat, essential for refuelling during migration, affects the population dynamics of migratory species. Using 20 years of continent-wide citizen science data, we assess population trends of ten shorebird taxa that refuel on Yellow Sea tidal mudflats, a threatened ecosystem that has shrunk by >65% in recent decades. Seven of the taxa declined at rates of up to 8% per year. Taxa with the greatest reliance on the Yellow Sea as a stopover site showed the greatest declines, whereas those that stop primarily in other regions had slowly declining or stable populations. Decline rate was unaffected by shared evolutionary history among taxa and was not predicted by migration distance, breeding range size, non-breeding location, generation time or body size. These results suggest that changes in stopover habitat can severely limit migratory populations.


Conflict of interest statement

The authors declare no competing financial interests.

Figures

Figure 1
Figure 1. Predictors of flyway-level population trend estimates between 1993–2012 for ten EAAF migratory shorebirds.
(a) Bayesian variable selection identifying predictors that are important (indicator value ≥0.75; green shading), inconclusive (indicator value between 0.25 and 0.75; yellow shading) and unimportant (indicator value ≤0.25; red shading). (b) Bayesian linear regression of Yellow Sea reliance as a predictor of flyway-level population trend estimates. Grey shading shows the 95% CRI around the regression line. Points show flyway-level population trend estimates, the mean annual rate of change in total abundance estimates. Error bars represent the 95% CRI around population trends. These analyses included the menzbieri subspecies of bar-tailed godwit and excluded the baueri subspecies (see Methods).
Figure 2
Figure 2. Total abundance between 1993 and 2012 for ten EAAF migratory shorebird taxa.
(af) Taxa are ordered from highest to lowest Yellow Sea reliance, the proportion of the flyway population that stages on Yellow Sea tidal mudflats to refuel for long-distance migrations. (a) Menzbieri bar-tailed godwit; (b) far eastern curlew; (c) curlew sandpiper; (d) great knot; (e) red knot; (f) lesser sand plover; (g) baueri bar-tailed godwit; (h) terek sandpiper; (i) red-necked stint; and (j) grey-tailed tattler. Total abundance estimates are posterior means from Bayesian N-mixture models of counts across Australia and New Zealand, including the majority of internationally important sites. Lines show posterior mean abundance estimates for each year, with red lines indicating taxa with credibly declining populations and grey shading denoting the 95% CRI. Overall trend estimates appear in Table 1. Detection probabilities for each taxon ranged from 0.52 to 0.68 (Supplementary Fig. 1) and were reflected in modelled abundances and trend estimates. Posterior predictive checks indicated good model fit in all cases (Supplementary Fig. 2).
Figure 3
Figure 3. Abundance between 1993 and 2012 for eight EAAF migratory shorebird taxa found in four non-breeding population nodes.
Abundance estimates are posterior means for each node from Bayesian N-mixture models of counts across Australia and New Zealand, including the majority of internationally important sites. Lines show posterior mean abundance estimates for each year, with red lines indicating credibly declining populations and grey shading denoting the 95% CRI. Map insets indicate the location of the four population nodes: (1) northwestern Australia; (2) Queensland; (3) southeastern Australia and (4) New Zealand. Lesser sand plover and the menzbieri subspecies of bar-tailed godwit were not included in analyses because they occurred on only one node.

References

    1. Wilcove D. S. & Wikelski M. Going, going, gone: is animal migration disappearing? PLoS Biol. 6, 1361–1364 (2008). - PMC - PubMed
    1. Harewood A. & Horrocks J. Impacts of coastal development on hawksbill hatchling survival and swimming success during the initial offshore migration. Biol. Conserv. 141, 394–401 (2008).
    1. Calles O. et al.. Size-dependent mortality of migratory silver eels at a hydropower plant, and implications for escapement to the sea. Freshwater Biol. 55, 2167–2180 (2010).
    1. Juillet C., Choquet R., Gauthier G., Lefebvre J. & Pradel R. Carry-over effects of spring hunt and climate on recruitment to the natal colony in a migratory species. J. Appl. Ecol. 49, 1237–1246 (2012).
    1. Sutherland W. J. et al.. A horizon scanning assessment of current and potential future threats to migratory shorebirds. IBIS 154, 663–679 (2012).

Publication types