. 2017 Apr 13:7:46396.
doi: 10.1038/srep46396.

Optical Coherence Tomography Angiography to Estimate Retinal Blood Flow in Eyes with Retinitis Pigmentosa

Affiliations

Optical Coherence Tomography Angiography to Estimate Retinal Blood Flow in Eyes with Retinitis Pigmentosa

Masako Sugahara et al. Sci Rep. .

Abstract

Ophthalmologists sometimes face difficulties in identifying the origin of visual acuity (VA) loss in a retinitis pigmentosa (RP) patient, particularly before cataract surgery: cataract or the retinal disease state. Therefore, it is important to identify the significant factors correlating with VA. Nowadays, retinal blood flow in superficial and deep layers can be estimated non-invasively using optical coherence tomography angiography (OCTA). We estimated blood flow per retinal layer by using OCTA; investigated the correlation between VA and other parameters including blood flow and retinal thickness; and identified the most associated factor with VA in patients with RP. OCTA images in 68 of consecutive 110 Japanese RP patients were analysable (analysable RP group). Thirty-two age- and axial length-matched healthy eyes (control group) were studied. In the analysable RP group, the parafoveal flow density in superficial and deep layers was 47.0 ± 4.9% and 52.4 ± 5.5%, respectively, which was significantly lower than that in controls. Using multivariate analysis, we found that the parafoveal flow density in the deep layer and superficial foveal avascular area were the factors associated with VA. Non-invasive estimation of retinal blood flow per retinal layer using OCTA is useful for predicting VA in RP patients.


Conflict of interest statement

There are potential competing financial interests. Nagahisa Yoshimura has received financial support from Topcon Corporation, Nidek, and Canon (unrelated to this study), and has provided consultancy services to Nidek. There are no patents, products in development, or marketed products to declare. The other authors declare no competing interests.

Figures

Figure 1
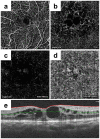
Figure 1. Representative optical coherence tomography angiography images and a fundus autofluorescence image.
Optical coherence tomography angiography and fundus autofluorescence images of a 44-year-old woman with retinitis pigmentosa, with visual acuity of 20/16 and a mean deviation value of −12.96 dB, are depicted. The retinal layer segmentation was automatically performed by the built-in software, and created en face images of the superficial (a), deep (b), outer retinal (c), and choriocapillaris layers (d). (e) An optical coherence tomography image with segmentation is shown. The red line indicates the internal limiting membrane, and the green line indicates the inner plexiform layer. (f) A fundus autofluorescence image showing broad damage to the retinal pigment epithelium.
Figure 2
Figure 2. Representative optical coherence tomography angiography images of segmentation error due to cystoid macular oedema.
Optical coherence tomography angiography images of a 67-year-old woman with retinitis pigmentosa with cystoid macular oedema. En face images of the superficial (a), deep (b), outer retinal (c), and choriocapillaris layers (d) are irregular due to segmentation errors (e). The red line indicates the internal limiting membrane, and the green line indicates the inner plexiform layer. We assigned these eyes to the non-analysable group.
Figure 3
Figure 3. Representative optical coherence tomography images of the parafoveal flow density.
Representative images of parafoveal flow density in the superficial (a,c,e,g,i,k) and deep (b,d,f,h,i,j,l) layers in five patients (aj) and one control (k,l). The grid is composed of two circles centred around the fovea: an inner circle with a diameter of 1.0 mm and an outer circle with a diameter of 2.5 mm. The parafoveal region was defined as the ring between the inner and outer circles. Images of the superficial (a) and deep (b) layers of an 18-year-old female retinitis pigmentosa (RP) patient with an axial length (AL) of 23.98 mm and a parafoveal flow density of 46.94% and 53.21%, respectively. Images of the superficial (c) and deep (d) layers of a 21-year-old male RP patient with an AL of 25.10 mm and a parafoveal flow density of 46.78% and 53.83%, respectively. Images of the superficial (e) and deep (f) layers of a 44-year-old female RP patient with an AL of 24.77 mm and a parafoveal flow density of 43.66% and 51.82%, respectively. Images of the superficial (g) and deep (h) layers of a 62-year-old male RP patient with an AL of 24.55 mm and a parafoveal flow density of 41.64% and 50.88%, respectively. Images of the superficial (i) and deep (j) layers of a 62-year-old male RP patient with an AL of 23.97 mm and a parafoveal flow density of 53.85% and 59.23%, respectively. Images of the superficial (k) and deep (l) layers of a 44-year-old male control with an AL of 24.33 mm and a parafoveal flow density of 58.56% and 64.53%, respectively.
Figure 4
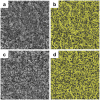
Figure 4. Representative optical coherence tomography images of the blood flow area rate of the choriocapillaris layer.
The blood flow area rate (%) of the choriocapillaris layer was measured in the full 3.0 × 3.0 mm square using built-in software. Shown are representative images before (a,c) and after (b,d) automatic binarization. (a,b) Images of an 18-year-old woman with retinitis pigmentosa with a blood flow area rate of the choriocapillaris layer of 61.8%. (c,d) Images of a 44-year-old male control with a blood flow area rate of the choriocapillaris layer of 62.3%.
Figure 5
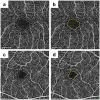
Figure 5. Representative optical coherence tomography images of the foveal avascular zone area.
Shown are representative images of the superficial layer before (a,c) and after (b,d) processing. The foveal avascular zone (FAZ) area (mm2) of the superficial and deep layers was manually measured using built-in software, and the area was corrected using parameters including axial length, the flatter meridian, the steeper meridian, and the spherical equivalent refraction in Littmann’s formula. (a,b) Images of a 51-year-old woman with retinitis pigmentosa with superficial FAZ area of 0.340 mm2 before correction, and of 0.237 mm2 after correction. (c,d) Images of a 39-year-old male control with superficial FAZ area of 0.204 mm2 before correction, and of 0.179 mm2 after correction.

References

    1. Hartong D. T., Berson E. L. & Dryja T. P. Retinitis pigmentosa. Lancet. 368, 1795–1809 (2006). - PubMed
    1. Makiyama Y. et al.. Macular cone abnormalities in retinitis pigmentosa with preserved central vision using adaptive optics scanning laser ophthalmoscopy. PLoS ONE. 8, e79447 (2013). - PMC - PubMed
    1. Otani A. et al.. Rescue of retinal degeneration by intravitreally injected adult bone marrow-derived lineage-negative hematopoietic stem cells. J. Clin. Invest. 114, 765–774 (2004). - PMC - PubMed
    1. Yoshida N. et al.. Factors affecting visual acuity after cataract surgery in patients with retinitis pigmentosa. Ophthalmology. 122, 903–908 (2015). - PubMed
    1. Krill A. E., Archer D. & Newell F. W. Fluorescein angiography in retinitis pigmentosa. Am. J. Ophthalmol. 69, 826–835 (1970). - PubMed

Publication types