. 2017 Apr 13:8:15063.
doi: 10.1038/ncomms15063.

Local inhibition of microtubule dynamics by dynein is required for neuronal cargo distribution

Affiliations

Local inhibition of microtubule dynamics by dynein is required for neuronal cargo distribution

Shaul Yogev et al. Nat Commun. .

Abstract

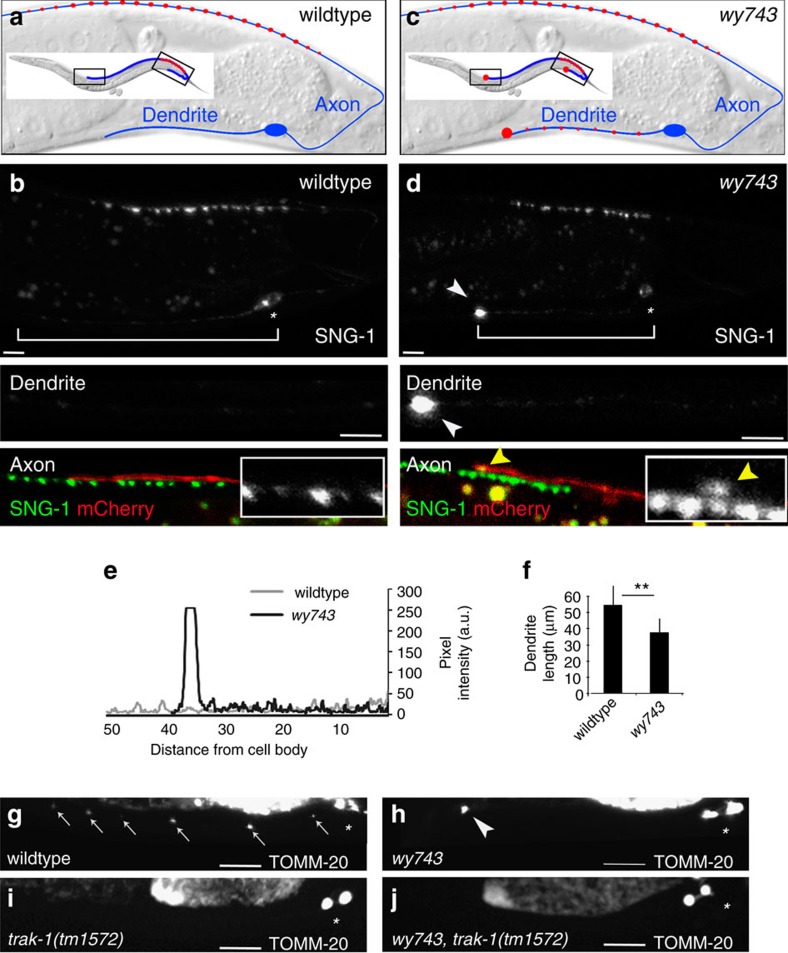
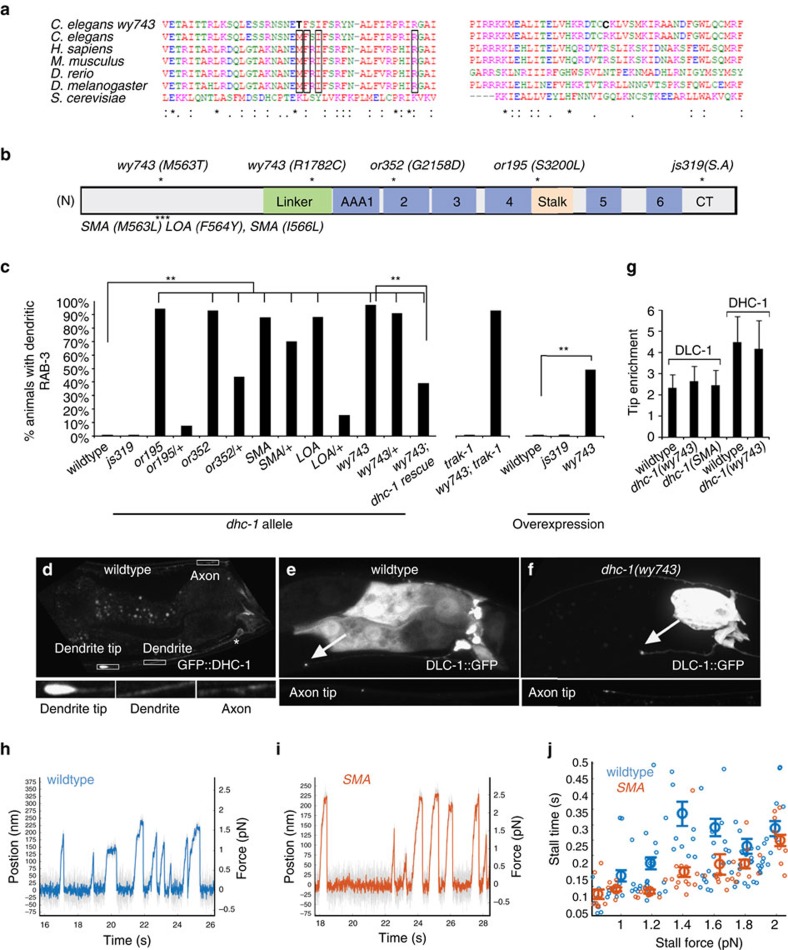
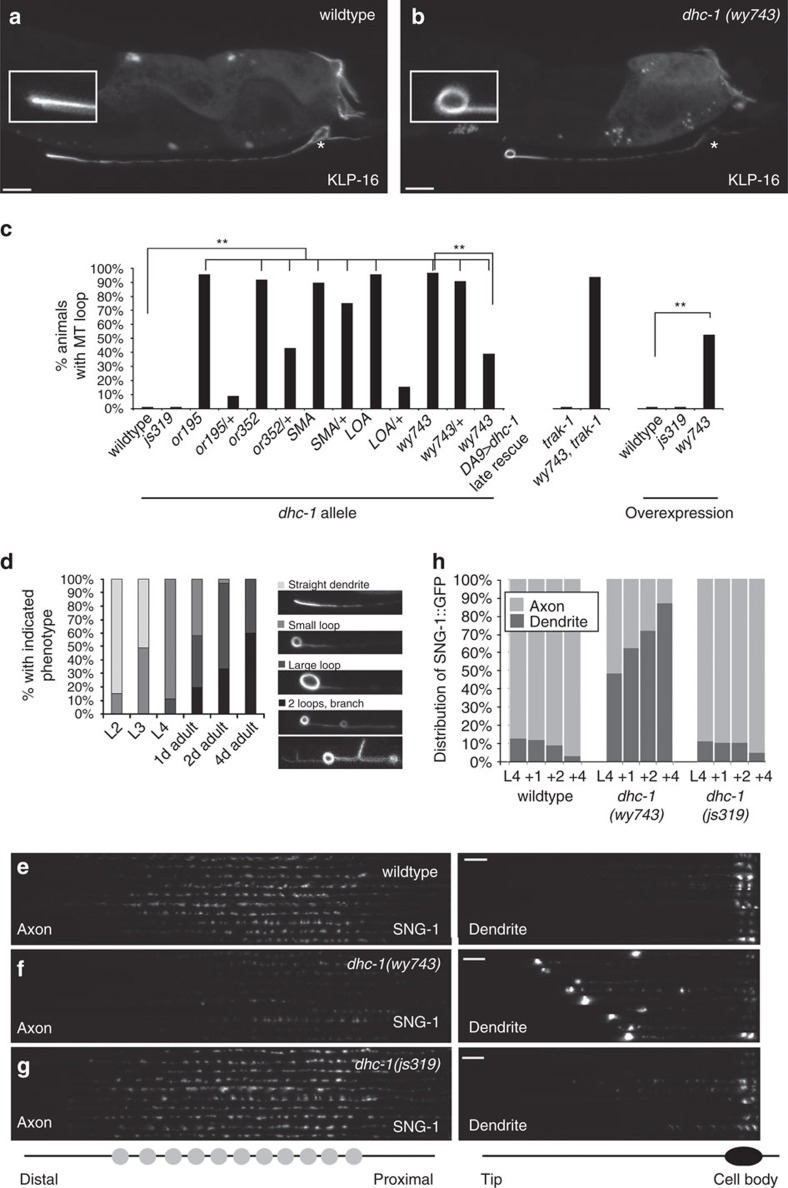
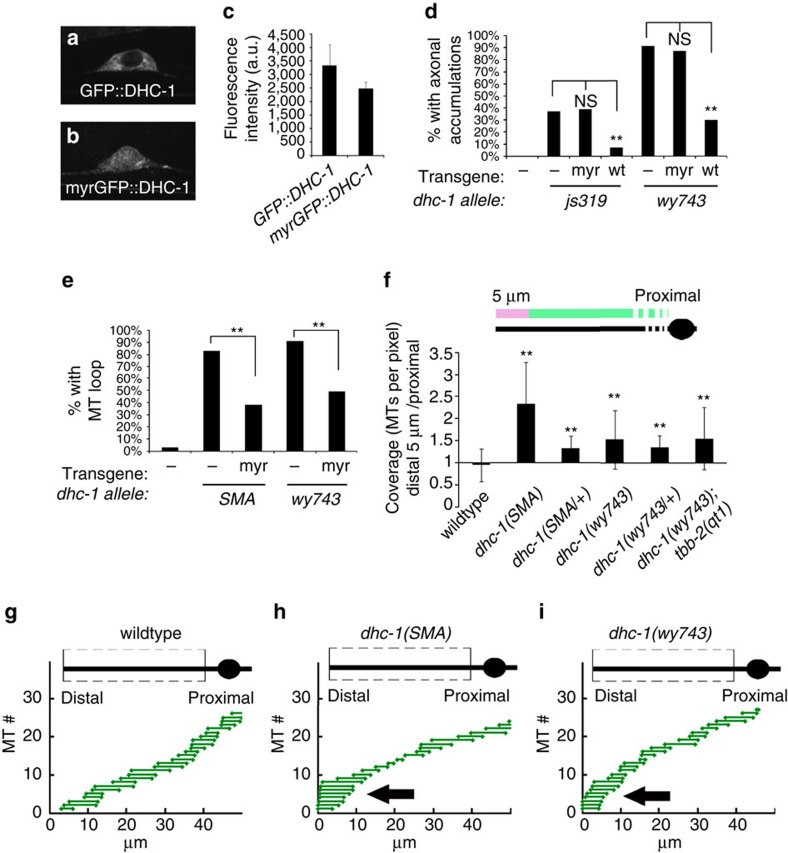
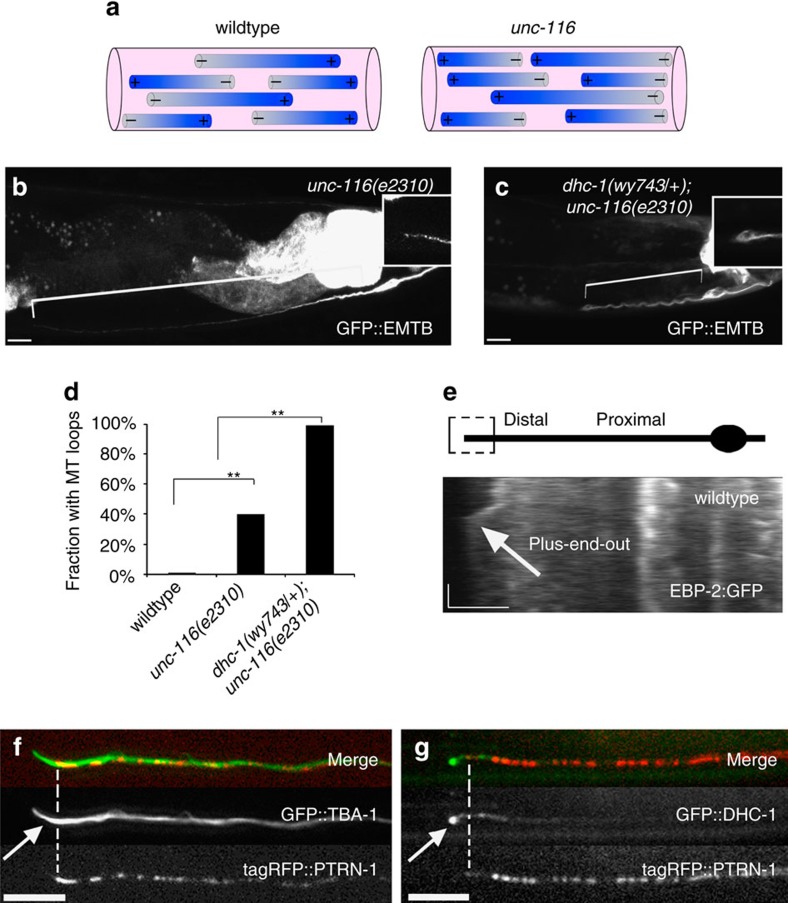
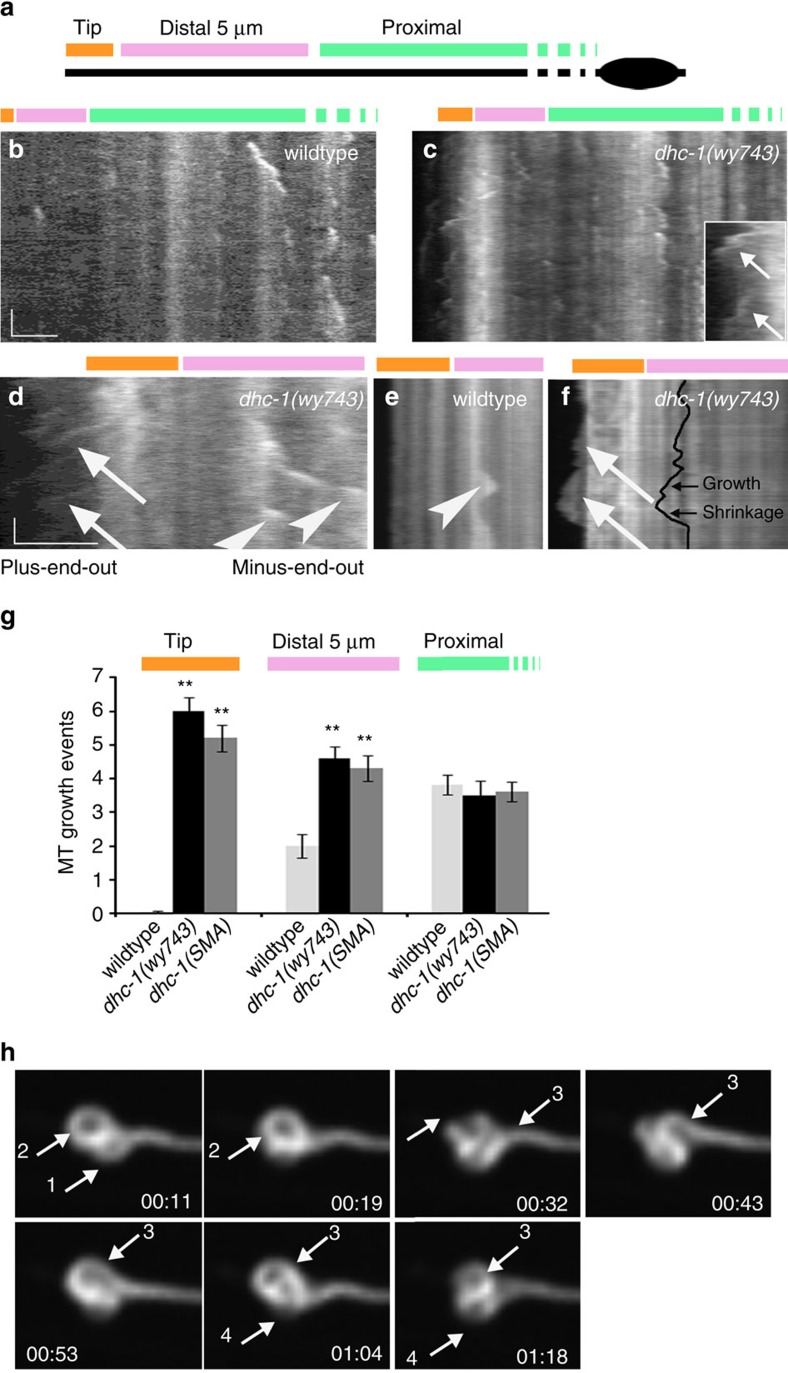
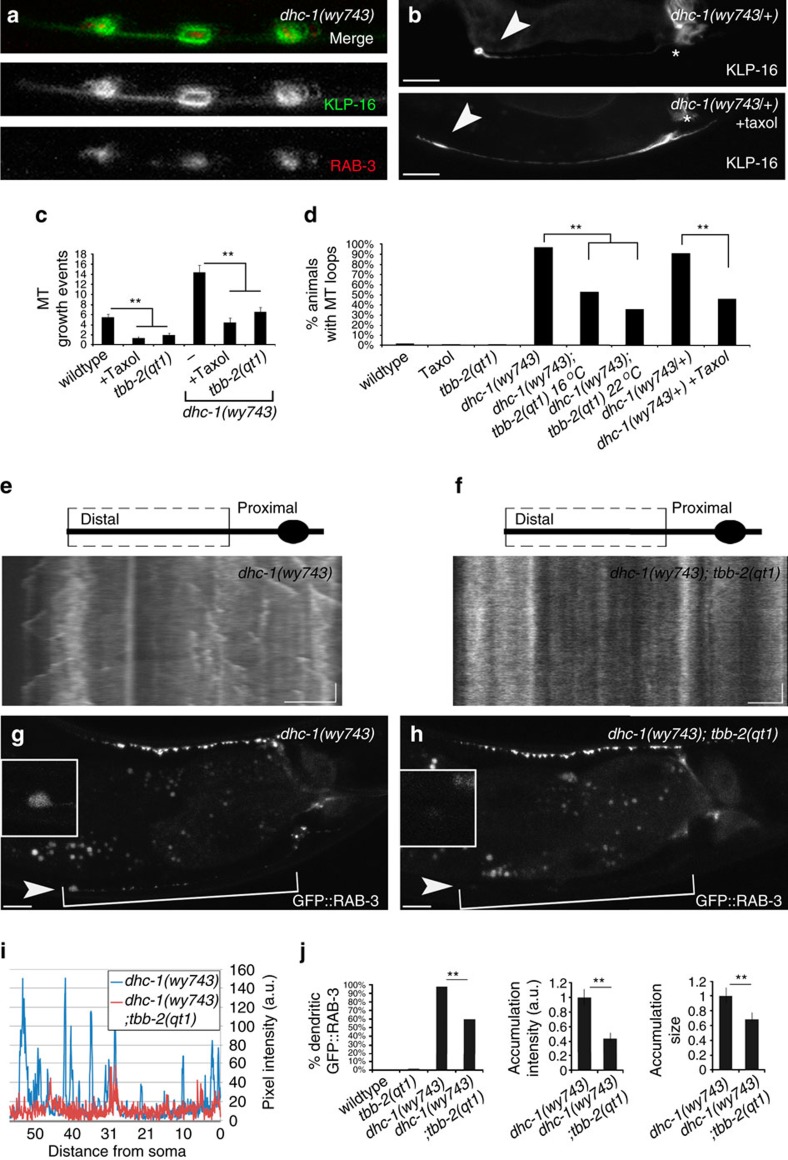
Abnormal axonal transport is associated with neuronal disease. We identified a role for DHC-1, the C. elegans dynein heavy chain, in maintaining neuronal cargo distribution. Surprisingly, this does not involve dynein's role as a retrograde motor in cargo transport, hinging instead on its ability to inhibit microtubule (MT) dynamics. Neuronal MTs are highly static, yet the mechanisms and functional significance of this property are not well understood. In disease-mimicking dhc-1 alleles, excessive MT growth and collapse occur at the dendrite tip, resulting in the formation of aberrant MT loops. These unstable MTs act as cargo traps, leading to ectopic accumulations of cargo and reduced availability of cargo at normal locations. Our data suggest that an anchored dynein pool interacts with plus-end-out MTs to stabilize MTs and allow efficient retrograde transport. These results identify functional significance for neuronal MT stability and suggest a mechanism for cellular dysfunction in dynein-linked disease.


Conflict of interest statement

The authors declare no competing financial interests.

Figures

Figure 1
Figure 1. Neuronal cargo accumulates at the tips of DA9 processes in wy743 mutants.
(a) Schematic diagrams of the DA9 neuron. Inset shows the entire axon. (b) wt L4 larva (anterior is left and dorsal up in all figures) showing SVPs labelled by synaptogyrin/SNG-1::GFP. The cell body is marked by an asterisk. Lower panels show magnifications of the dendrite and the axon tip. Co-labelling with cytoplasmic mCherry (red) was used to identify the tip of the DA9 axon. Scale bar is 5 μm in all panels and figures. (c) Schematic diagram of the ectopic SVP accumulations in wy743 dendrites. (d) synaptogirin/SNG-1::GFP accumulates at the tips of wy743 processes. White arrowhead indicates the dendritic accumulation (top and middle panel), and yellow arrowheads point to SNG-1::GFP that mis-accumulates at the tip of the axon (lower panel). (e) Intensity plot of synaptogyrin/SNG-1::GFP fluorescence in wt (grey) and wy743 (black) dendrites from b and c, showing the enrichment of SVPs at the distal tip. (f) Dendrite length is reduced in wy743 mutants. n=30 per genotype, P<0.01, χ2-test. (g,h) The mitochondrial marker TOMM-20::YFP is evenly distributed in wt dendrites (indicated by arrows in g) but accumulates at the tip in wy743 mutants (arrowhead in h). (i) In trak-1 mutants mitochondria do not enter the dendrite. (j) In wy743; trak-1 double mutants, the mitochondria are confined to the cell body, suggesting that TOMM-20::YFP is correctly sorted.
Figure 2
Figure 2. wy743 is an allele of dhc-1.
(a) Alignment of dynein heavy chain sequences encoding the N terminal (left) and linker domains (right), shows their high conservation. The mutated residues in wy743 are highlighted. Boxes mark mutations that are associated with neuronal dysfunction in mice and humans. (b) Schematic drawing of DHC-1, with the conserved domains indicated. C. elegans mutations are indicated above, and the mouse and human mutations are marked beneath the scheme. (c) Quantification of dendritic SVP accumulations in dhc-1 mutant alleles and transgenic rescue with genomic dhc-1 fragment. L4 and young adults were examined on a wide-field microscope, and any worm with a GFP::RAB-3 signal at the tip of the denrite was scored as positive. n=27–60, **P<0.01, χ2-test. (d) Subcellular localization of a rescuing GFP::DHC-1 transgene expressed specifically in DA9. (e) DLC-1::GFP is also enriched at the dendrite tip and can be detected at the axon tip. (f) In dhc-1(wy743) mutants, the distribution of DLC-1::GFP is similar to wt. (g) Dynein tip enrichment was quantified as the ratio between GFP::DHC-1 or DLC-1::GFP in the tip and the entire dendrite, and normalized to a soluble mCherry marker. n=17–23. H,I. Representative stall-force traces for wildtype (h) and SMA (i) dynein immunoprecipitated with a FLAG tag from COS-7 cells. (j) Plot of stall-force vs. stall time showing that SMA dynein is less processive than wildtype n=270 (control) and 220 (SMA) from two independent experiments. P<0.01 for the range between 0.2 and 0.6 s, ANOVA. Note that the range of forces observed is consistent with 1–2 motors. SA, splice acceptor.
Figure 3
Figure 3. Aberrant MT structures underlie SVP depletion from presynapses in dhc-1 mutants.
(a,b) NCD/KLP-16::YFP fluorescence on dendritic MTs. KLP-16 is a minus-end-directed NCD-type motor, and is therefore enriched at the distal dendrite, reflecting the minus-end-out orientation of dendritic MTs. In a wt dendrite (a), MTs are straight. In dhc-1(wy743) (b), MTs show a prominent loop at the tip of the dendrite. (c) Quantification of dendritic MT loops in different dhc-1 alleles and DA9 specific rescue. n=32–89 per genotype, **P<0.01. (d) Time course of MT morphological defects in dhc-1(wy743). (eg) Alignments of axons (left) and dendrites (right) taken from synaptogirin/SNG-1::GFP expressing worms at adult day 4 under identical settings. In dhc-1(wy743), the dendritic accumulations correlate with a depletion of SVPs from the presynapses. (h) Quantification of synaptogirin/SNG-1::GFP fluorescence in L4 through adult day 4 worms. dhc-1(wy743) gradually lose their synaptic SVPs as they accumulate in the dendrite. dhc-1(js319), similar to wt, maintains the dendrite/axon SNG-1::GFP ratio.
Figure 4
Figure 4. dhc-1 cortical rescue and a distal shift in MT distribution in dhc-1 mutants.
(a) GFP::DHC-1 is localized to the cytoplasm. (b) myrGFP::DHC-1 shows a distribution consistent with membrane localization. (c) Expression levels of GFP::DHC-1 and myrGFP::DHC-1 were quantified after imaging in identical settings. n=17 per genotype. (d) The myrGFP::DHC-1 construct does not rescue the accumulation of axonal SVPs (GFP::RAB-3). n=20–25, **P<0.05. (e) membrane tethered myrGFP::DHC-1 rescues MT loop formation in dhc-1 mutants. n=28–45, **P<0.05. (f) Ratio between MT coverage (number of MTs per pixel) in the distal 5 μm of the dendrite to the rest of the dendrite. The results indicate that the distribution of MTs is shifted distally in dhc-1 mutants. (gi) Representations of MTs in the dendrites of indicated phenotypes. The representation is derived from a quantized GFP::TBA signal, where steps up indicate a MT start and steps down a MT end. MT ends were randomly assigned to the longest MT in the bundle for representation purposes. See Methods for details.
Figure 5
Figure 5. DHC-1 acts on plus-end-out MTs.
(a) Scheme illustrating MT polarity in wt dendrites (mixed, but mostly minus-end-out) versus unc-116(e2310) dendrites (uniformly plus-end-out). (b) MTs, labelled by GFP::EMTB, in unc-116(e2310) mutant dendrites. (c) In dhc-1(wy743/+); unc-116(e2310) double mutants the terminal MT loop is apparent in all dendrites despite the plus-end-out orientation of MTs. (d) Quantification of MT loops in the indicated genotypes. n=25–31, **P<0.01. (e) A rare example of plus-end-out MT growth (labelled by EBP-2::GFP) at the tip of a wildtype dendrite. (f) tagRFP::PTRN-1 labels MT minus-ends. The presence of the MT marker GFP::TBA-1 after the distal-most tagRFP::PTRN-1 punctum indicates the presence of plus-end-out MTs at the dendrite tip. (g) GFP::DHC-1 accumulates distal to the last tagRFP::PTRN-1 punctum, suggesting that dynein is positioned in a location that allows it to interact with MT plus-ends.
Figure 6
Figure 6. Highly dynamic plus-end-out MTs at the tip of the dendrite in dhc-1mutants.
(a) Scheme illustrating the division of the dendrite into three areas. (b) Kymograph from EBP-2::GFP movies of a wt L4 animal. MT growth is detected mostly near the cell body. (c) MT dynamics are increased in the distal dendrites of dhc-1 mutants, particularly at the tip, where abundant plus-end-distal growth is observed (arrows). (d) An enlarged view of the distal dendrite from a dhc-1(wy743) animal. Abundant plus-end-out growth is detected (arrows). Before the tip, an elevation in the number of plus-end-proximal EBP-2::GFP comets (arrowheads) mirrors the increase in MT coverage of this area. (e) GFP::TBA-1 movie of wt reveals that growth of minus-end-out MTs (arrowhead) at the distal dendrite is coupled to shrinkage. No growth is observed at the tip. (f) Plus-end-distal growth of MTs (arrow) in the terminal loop of dhc-1 mutants, visualized with GFP::TBA-1, is coupled to shrinkage. (g) The number of MT growth events (defined as either an EBP-2::GFP comet or a GFP::TBA-1 growth signal) in dhc-1 mutants is mildly elevated in the distal dendrite and drastically elevated at the tip. n=24–37 movies per genotype. **P<0.01. See Supplementary Fig. 8 for quantifications of additional dynamic parameters. (h) Single frames from a GFP::TBA movie of dhc-1(wy743) showing the formation and collapse of four MT loops (arrows). The buckling of loop 3 and the collapse of loop 2 are particularly evident.
Figure 7
Figure 7. MT instability is the cause of structural defects and cargo accumulation in dhc-1 mutants.
(a) SVPs, marked by RAB-3::TdTomato (red) colocalize with secondary MT loops (NCD/KLP-16::YFP, green) in the dendrite of 3-day-old dhc-1(wy743) mutants. (b) MT stabilization by Taxol rescues loop formation in dhc-1(wy743/+) animals. (c) Quantification of MT dynamics in the presence of Taxol or the MT stabilizing mutation tbb-2(qt1) suggests that tbb-2(qt1) effectively stabilizes neuronal MTs in DA9. n=20–26 kymographs PER genotype, **P<0.01. (d) Quantification of the suppression of the terminal MT loop in dhc-1 mutants by Taxol, or with the MT stabilizing mutation tbb-2(qt1).Note that some suppression occurs at the permissive temperature. This may reflect either a partial loss of function at the permissive temperature, or the fast-acting nature of this allele. n=31–39 animals per genotype, **P<0.01. (e,f) Kymographs showing the stabilizing effect of tbb-2(qt1) on MTs in dhc-1 mutants. dhc-1(wy743) mutants (e) show abundant MT growth, at the loop and the distal dendrite. This growth is suppressed in the double mutant dhc-1(wy743); tbb-2(qt1) (f). (g,h) Suppressing MT dynamics in dhc-1 mutants abrogates cargo accumulation at the tip of the dendrite. dhc-1(wy743) mutants (g) show the typical SVP accumulation (markerd by GFP::RAB-3) at the tip of the dendrite. In dhc-1(wy743); tbb-2(qt1) double mutants (h) the accumulations are strongly reduced. (i) Fluorescence intensity profile of GFP::RAB-3 in the dendrite shows that SVP accumulations in dhc-1(wy743) are effectively eliminated by tbb-2(qt1) induced MT stabilization. (j) Quantifications of the frequency, size (normalized) and intensity of GFP::RAB-3 accumulations. The MT stabilizing mutation tbb-2(qt1) effectively reduces all these parameters in dhc-1(wy743) mutants. n=23–25 images per genotype, **P<0.01.

Similar articles

Cited by

References

    1. Conde C. & Caceres A. Microtubule assembly, organization and dynamics in axons and dendrites. Nat. Rev. Neurosci. 10, 319–332 (2009). - PubMed
    1. Janke C. & Kneussel M. Tubulin post-translational modifications: encoding functions on the neuronal microtubule cytoskeleton. Trends Neurosci. 33, 362–372 (2010). - PubMed
    1. Kapitein L. C. & Hoogenraad C. C. Building the neuronal microtubule cytoskeleton. Neuron 87, 492–506 (2015). - PubMed
    1. Coles C. H. & Bradke F. Coordinating neuronal actin-microtubule dynamics. Curr. Biol. 25, R677–R691 (2015). - PubMed
    1. Millecamps S. & Julien J. P. Axonal transport deficits and neurodegenerative diseases. Nat. Rev. Neurosci. 14, 161–176 (2013). - PubMed

Publication types

MeSH terms

Substances

LinkOut - more resources