. 2017 Apr 12;544(7649):212-216.
doi: 10.1038/nature21718.

Topological defects in epithelia govern cell death and extrusion

Affiliations

Topological defects in epithelia govern cell death and extrusion

Thuan Beng Saw et al. Nature. .

Abstract

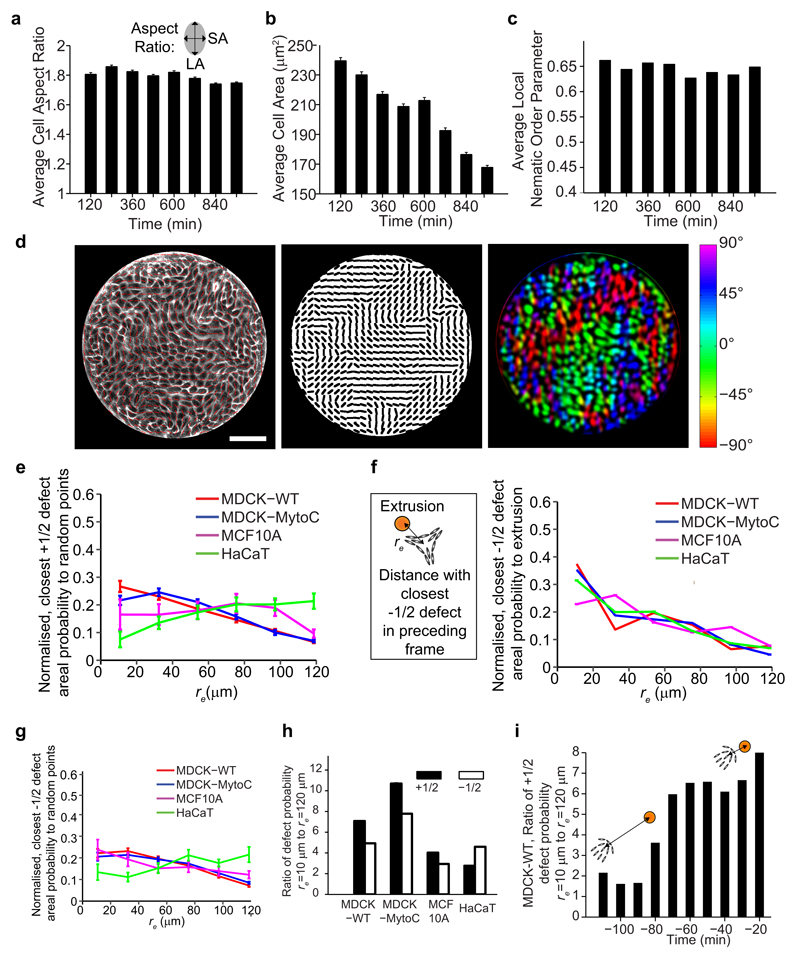
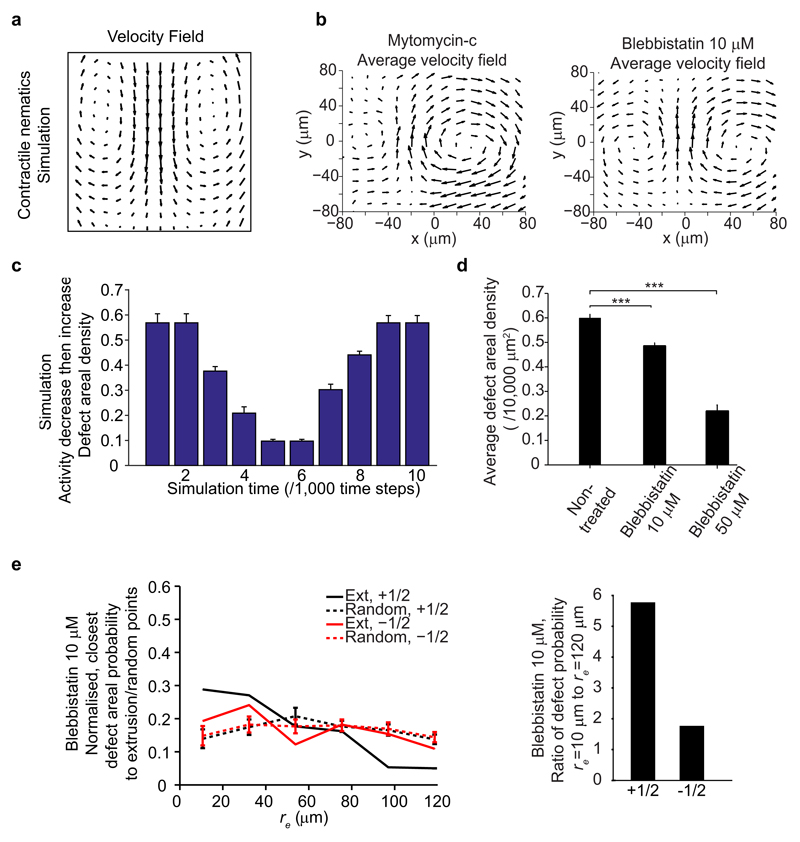
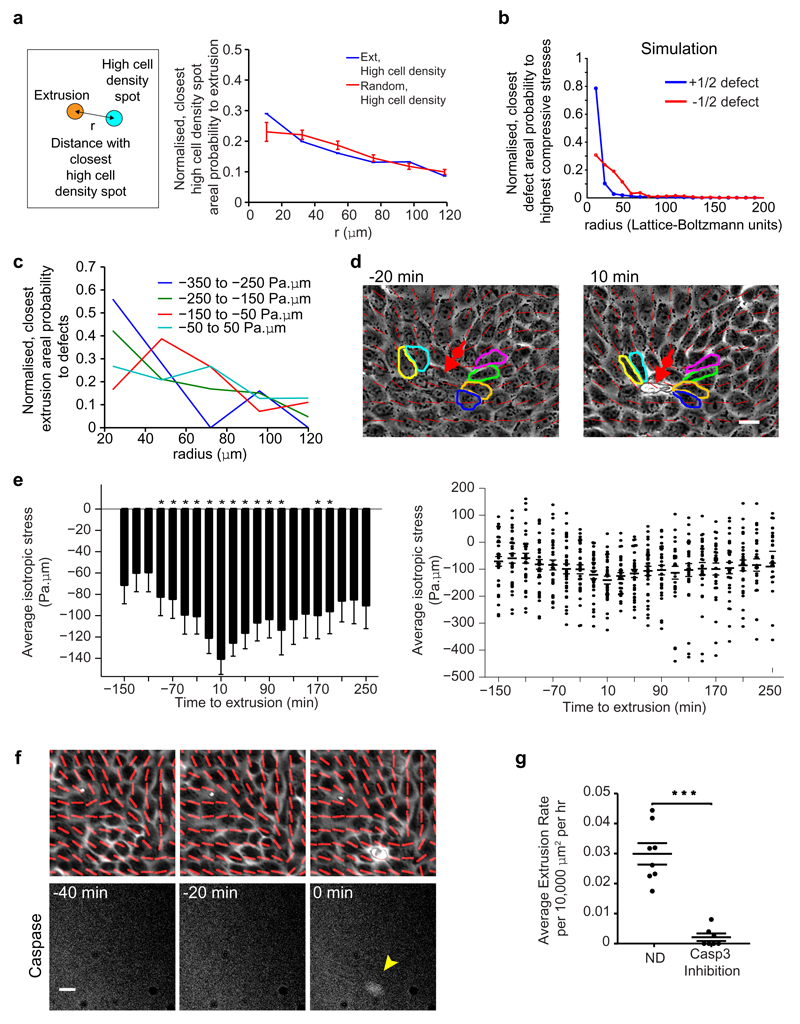
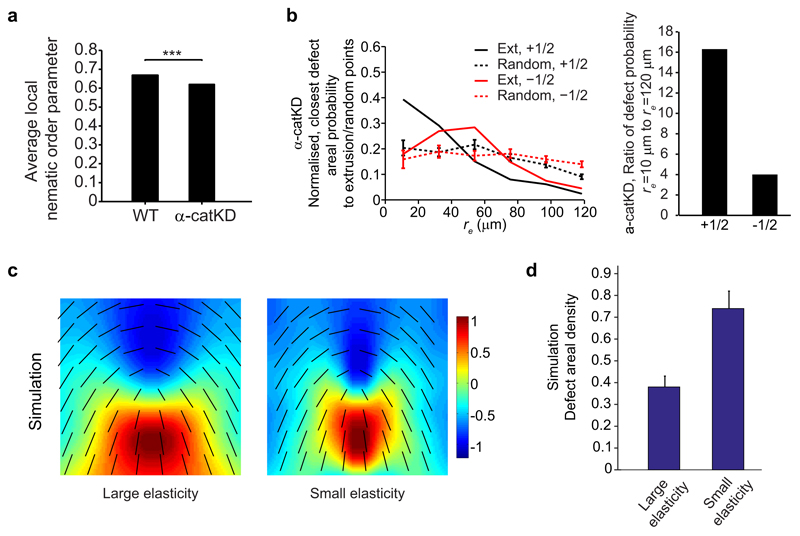
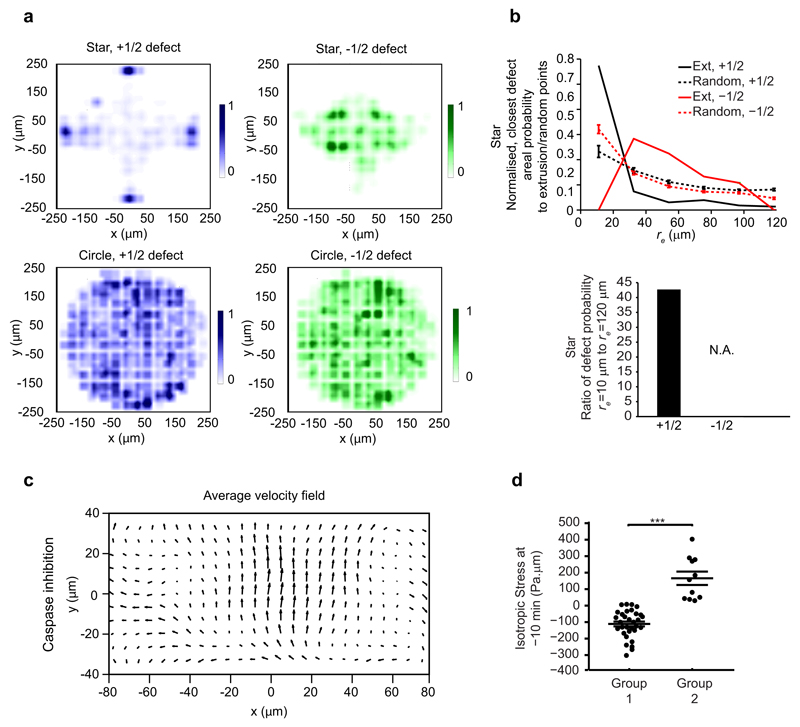
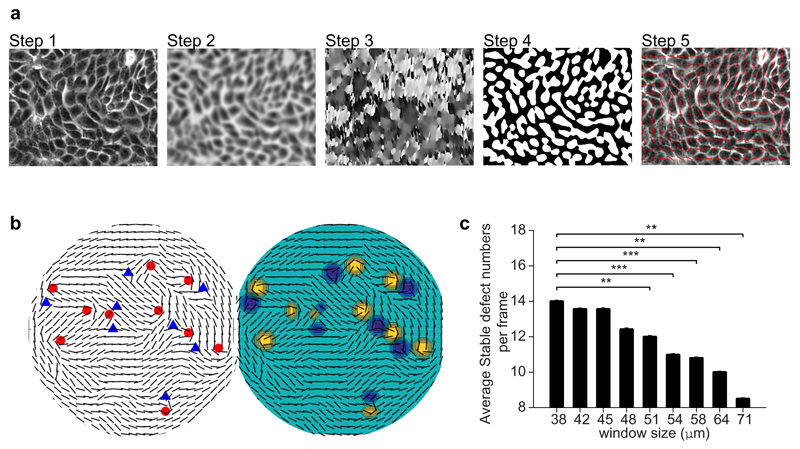
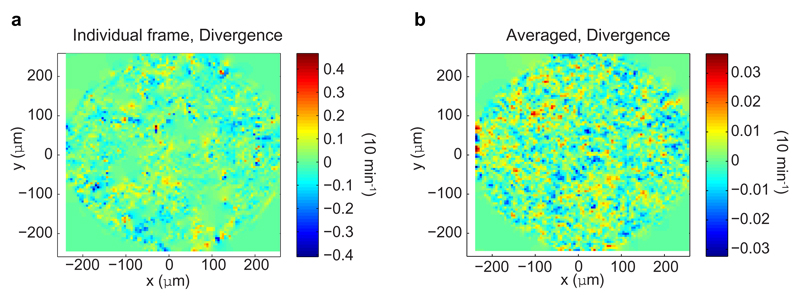
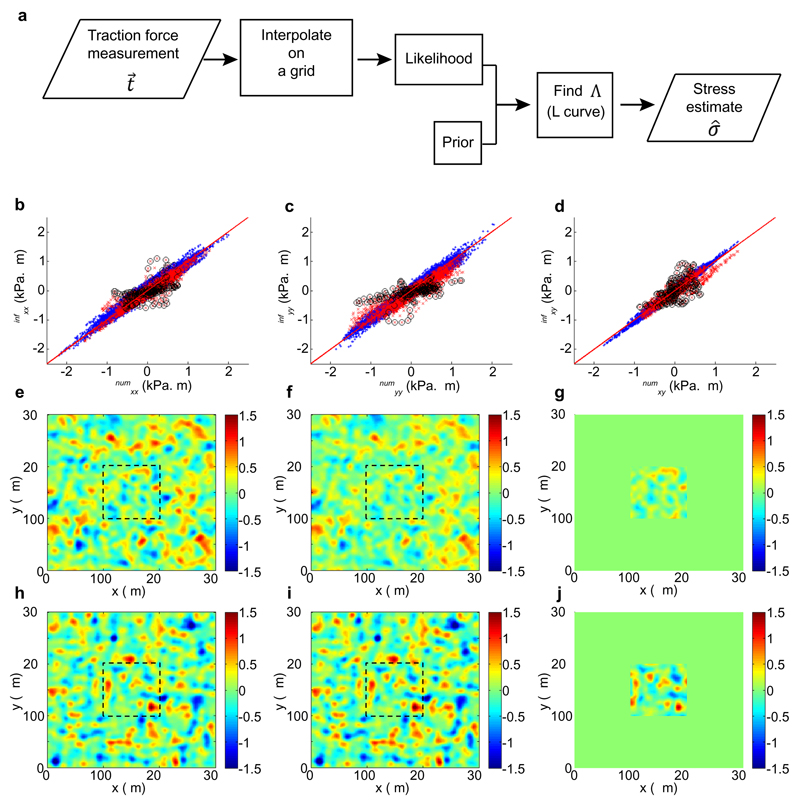
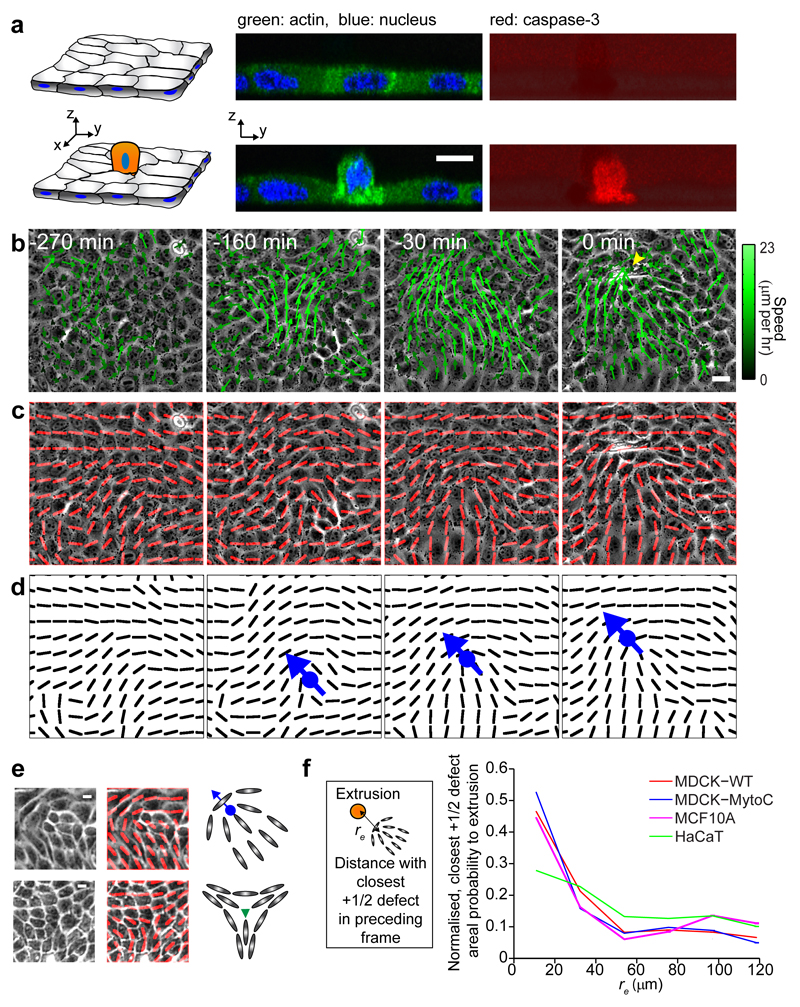
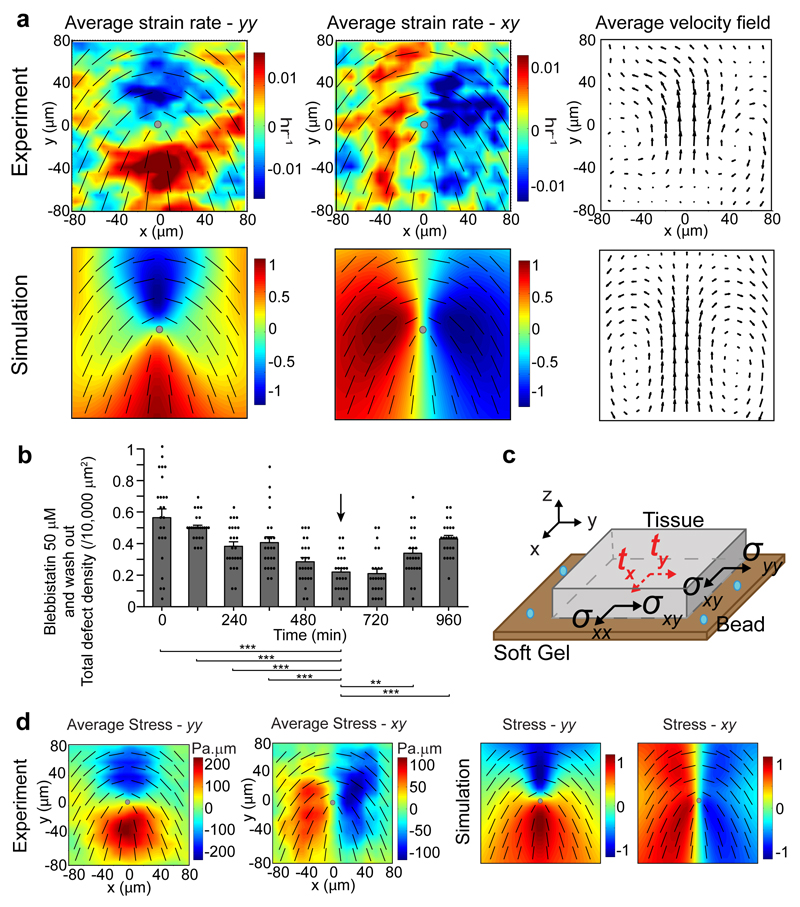
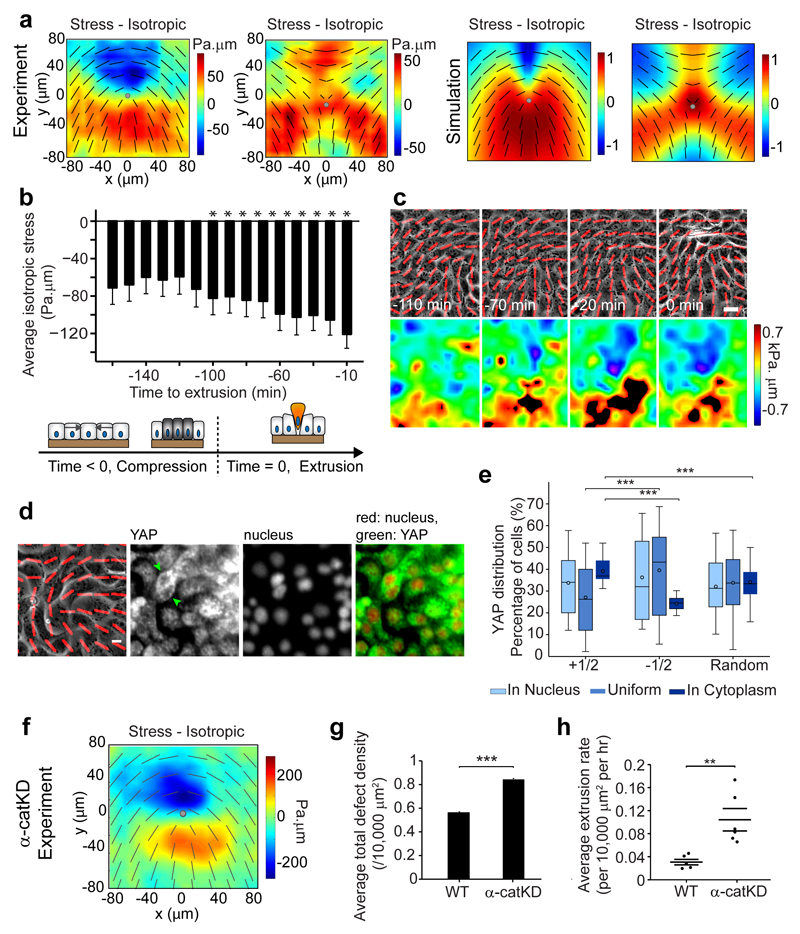
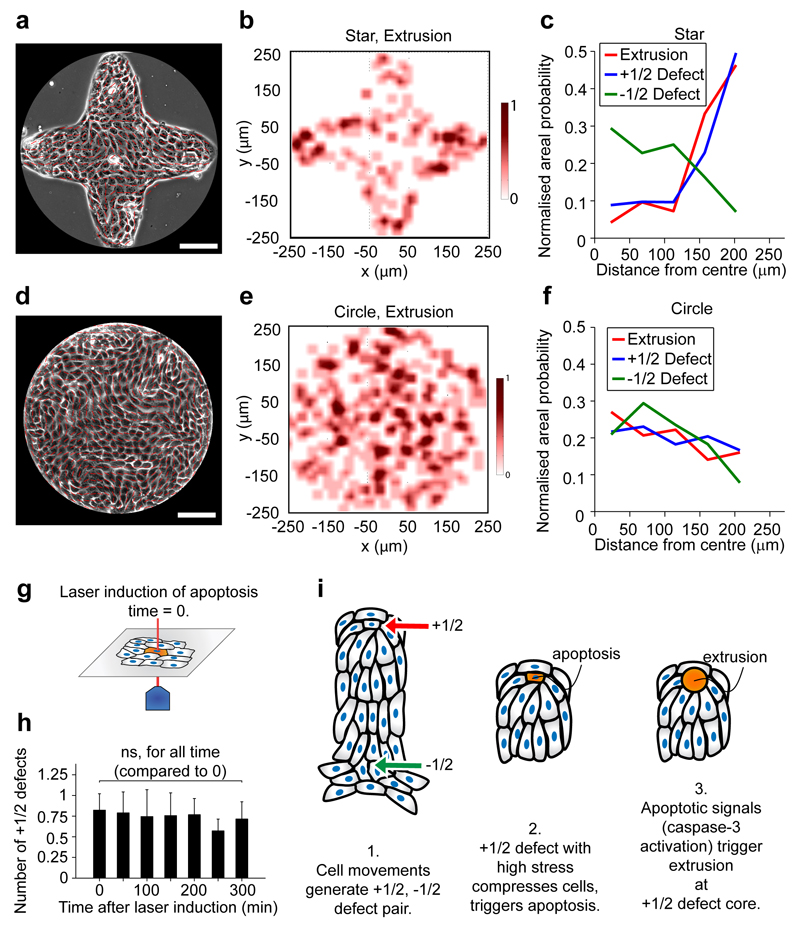
Epithelial tissues (epithelia) remove excess cells through extrusion, preventing the accumulation of unnecessary or pathological cells. The extrusion process can be triggered by apoptotic signalling, oncogenic transformation and overcrowding of cells. Despite the important linkage of cell extrusion to developmental, homeostatic and pathological processes such as cancer metastasis, its underlying mechanism and connections to the intrinsic mechanics of the epithelium are largely unexplored. We approach this problem by modelling the epithelium as an active nematic liquid crystal (that has a long range directional order), and comparing numerical simulations to strain rate and stress measurements within monolayers of MDCK (Madin Darby canine kidney) cells. Here we show that apoptotic cell extrusion is provoked by singularities in cell alignments in the form of comet-shaped topological defects. We find a universal correlation between extrusion sites and positions of nematic defects in the cell orientation field in different epithelium types. The results confirm the active nematic nature of epithelia, and demonstrate that defect-induced isotropic stresses are the primary precursors of mechanotransductive responses in cells, including YAP (Yes-associated protein) transcription factor activity, caspase-3-mediated cell death, and extrusions. Importantly, the defect-driven extrusion mechanism depends on intercellular junctions, because the weakening of cell-cell interactions in an α-catenin knockdown monolayer reduces the defect size and increases both the number of defects and extrusion rates, as is also predicted by our model. We further demonstrate the ability to control extrusion hotspots by geometrically inducing defects through microcontact printing of patterned monolayers. On the basis of these results, we propose a mechanism for apoptotic cell extrusion: spontaneously formed topological defects in epithelia govern cell fate. This will be important in predicting extrusion hotspots and dynamics in vivo, with potential applications to tissue regeneration and the suppression of metastasis. Moreover, we anticipate that the analogy between the epithelium and active nematic liquid crystals will trigger further investigations of the link between cellular processes and the material properties of epithelia.


Conflict of interest statement

Authors do not have conflict of interests to declare.

Figures

Extended Data Figure 1
Extended Data Figure 1. Further characterization of cell, monolayer and extrusion-defect correlation properties.
a, b, Time evolution of cell aspect ratio and cell area in a confluent MDCK epithelium. Data for each time point is binned over a duration of 120 min. From lowest to highest time points, n = 5101, 5537, 5772, 6549, 6572, 6876, 6593 and 6831 cells. c, Time evolution of nematic measure (averaged local order parameter, S) of corresponding epithelium (see Methods), n = 294 data points for each bar. d, MDCK monolayer in circular confinement (left). Red lines (represented again as black lines in middle) show local cell orientation, colour coded in right. Scale bar, 100 μm. e, Normalized, number of closest +1/2 defects per unit area as function of re against random points in monolayer. n = 30 different random point sets. See Methods. f, Schematic: determination of correlation between -1/2 defects and extrusions: distance, re of each extrusion to its closest -1/2 defect in preceding frame is measured, and the number of these defects per unit area as function of re is normalized (right). See Methods. n = 50 (MDCK, WT) extrusions from 4 independent movies in 3 independent experiments, n = 61 (MDCK, mytomycin-c) extrusions from 3 independent movies in 2 independent experiments, n = 85 (MCF10A) extrusions in 2 independent movies, n = 79 (HaCaT) extrusions in 2 independent movies. g, Similar plot as (e), but between random points and -1/2 defects. h, Ratio of closest defect density against extrusion points at re = 10 μm to re = 120 μm (first and last points in respective density curves). i, Ratio of the closest +1/2 defect density against eventual extrusion points, at re = 10 μm to re = 120 μm, as function of +1/2 defect distributions at each time point (WT-MDCK). All data represented as mean ± s.e.m.
Extended Data Figure 2
Extended Data Figure 2. Further examination of the active nematic properties and the extrusion correlation to defects in the epithelium under different conditions.
a, Velocity field around +1/2 defect in contractile, active nematic liquid crystal simulation. b, Average velocity field around +1/2 defect for mytomycin-c and blebbistatin treated MDCK. n = 2003 (mytomycin-c) defects from 3 independent movies in 2 independent experiments, n = 3061 (blebbistatin) defects from 3 independent movies. +1/2 defect has same orientation and position as in Fig. 2a. c, Total defect areal density evolution in simulation, activity parameter decreased at simulation time t = 0, then increased at t = 5. d, Average total defect density for WT-MDCK and blebbistatin (10 μM and 50 μM) treated MDCK. n = 314 frames from 4 independent movies in 3 independent experiments (WT), n = 155 frames from 3 independent movies (blebbistatin 10 μM), n = 26 frames from 4 independent movies (blebbistatin, 50 μM). t-test, ***P < 0.001. e, (left) Normalized, number of closest + and -1/2 defects per unit area as function of distance, re against extrusion and random points in 10 μM blebbistatin treated monolayer. n = 78 extrusions in 3 independent movies. n = 30 different random point sets. (right) Ratio of closest defect density against extrusion points at re = 10 μm to re = 120 μm. All data represented as mean ± s.e.m.
Extended Data Figure 3
Extended Data Figure 3. Further investigation of the relation between local cell density, compressive stress, defects and extrusions, and the role of caspase-3 activation.
a, Normalized, number of closest high cell density spots per unit area as function of radius, r against extrusions or random points in monolayer. n = 50 (MDCK, WT) extrusions from 4 independent movies in 3 independent experiments. n = 30 different random point sets. b, Normalized, number of closest defects per unit area as function of distance, re against spots with top 5% of all compressive stresses in simulation domain. See Methods for calculation of simulation stress. c, Normalized, number of closest extrusions per unit area as a function of distance against +1/2 defects, grouped by magnitude of compressive stress at head regions of defects. Extrusions are within 40 min after the frame of defect. From lowest (least negative) to highest compressive isotropic stress (most negative), n = 331, 215, 180 and 72 defects in 2 independent experiments. d, Typical example of extrusion event, showing configuration of +1/2 defect before and after extrusion. The same neighbor cell before (t < 0 min) and after (t > 0 min) extrusion is outlined with same color. e, (left) Same data as Fig. 3b, evolution of average isotropic stress around cells to extrude at t = 0 min with negative values, before and after extrusion (n = 32 extrusions in 2 independent experiments). t-test for each time point against normal distribution centred at zero, *P < 0.0001. (right) Scatter plot of same data. f, Typical example of extrusion event with caspase-3 activation (yellow arrowhead) (t = 0 min). Red lines show local cell orientation. g, Average extrusion rate in non-drug-treated (ND) and caspase-3 inhibited MDCK. n = 8 (ND) independent movies in 3 independent experiments, n = 7 (caspase-3 inhibited) independent movies in 2 independent experiments. ks-test, ***P < 0.001. All data represented as mean ± s.e.m.
Extended Data Figure 4
Extended Data Figure 4. Order parameter and extrusion-defect correlation for α-catKD MDCK, and simulations comparing small and large nematic bending elasiticity.
a, Average local order parameter, S for WT and α-catKD MDCK epithelium. n = 3 (WT) independent movies in 2 independent experiments, n = 3 (α-catKD) independent movies. t-test, ***P < 0.001. b, (left) Normalized, number of closest + and -1/2 defects per unit area as function of distance, re against extrusion and random pointsin α-catKD MDCK. n = 56 extrusions in 3 independent movies. n = 30 different random point sets. (right) Ratio of closest defect density against extrusion points at re = 10 μm to re = 120 μm. c, d, Simulations comparing size of defects (c) and total defect areal density (d) for small and large nematic bending elasticity, K. K is 0.02 and 0.08 for (c), and 0.04 and 0.08 for (d). All data represented as mean ± s.e.m.
Extended Data Figure 5
Extended Data Figure 5. Further analysis on topologically induced defects and extrusions.
a, Normalized number of + and -1/2 defects per unit area maps in star and circle epithelium confinements. n = 6738 (+1/2) defects and n = 5083 (-1/2) defects from 12 independent movies in 2 independent experiments (star), n = 5389 (+1/2) defects and n = 4858 (-1/2) defects from 8 independent movies in 3 independent experiments (circle). b, (left) Normalized, number of closest + and -1/2 defects per unit area as function of distance, re against extrusion and random points in star-shaped monolayer. n = 145 extrusions from 12 independent movies in 2 independent experiments. n = 30 different random point sets. (right) Ratio of closest defect density against extrusion points at re = 10 μm to re = 120 μm. c, Average velocity field around +1/2 defect in caspase-3 inhibited monolayer. n = 2993 defects from 7 independent movies in 2 independent experiments. Defect has same orientation and position as in Fig. 2a. d, Isotropic stress measured around cells just before extrusion (t = 0 min is time of extrusion). >70% (<30%) of cells experienced negative (positive resp.) stress, denoted as Group 1 (Group 2 resp.). n =44 total number of extrusions in 2 independent movies. ks-test, ***P < 0.001. All data represented as mean ± s.e.m.
Extended Data Figure 6
Extended Data Figure 6. Automated nematic director detection and robustness study.
a, 5 step process of automated nematic director detection. (Step 1) Phase contrast image of monolayer is obtained. (Step 2) Details of image is smoothened. (Step 3) Local orientation of cells are obtained using OrientationJ. (Step 4) Local contrast is applied to identify cell body regions. (Step 5) Nematic directors are obtained. b, Example of defect detection in a given nematic director field using winding number approach (left, red for +1/2 defect, blue for -1/2 defect) and diffusive charge approach (right, yellow for +1/2 defect, blue for -1/2 defect). c, Number of stable defects detected as function of window size to average over number of local cell orientations. Averaging is done over n = 50 frames of a monolayer movie, for each window size analysis. ks-test, **P < 0.01, ***P < 0.001. Data are represented as mean ± s.e.m.
Extended Data Figure 7
Extended Data Figure 7. Epithelium can be modeled as a 2D, incompressible material.
a, (left) One snapshot of instantaneous (for every 10 min frame interval) velocity divergence field in circularly confined epithelium. (right) Temporal average of velocity divergence field in circularly confined epithelium (averaged over ˜ 20 hrs or 128 images consecutively).
Extended Data Figure 8
Extended Data Figure 8. Bayesian Inference Stress Method (BISM) and robustness study
a, Schematic of inference algorithm. b-d, Plots of inferred stress vs. simulated stress for each component, in kPa.μm. Red line is bisector y = x. Blue dots: 3N×3N stress, σwhole for the whole system, Red dots: N×N stress, σcentral for the central region, Black circles: stresses obtained less than 2 μm from the boundary of the central region. e-g, Pressure and h-j, shear stress fields in kPa.μm: from left to right exact values, σnum, inferred values obtained for whole monolayer, σwhole and inferred values obtained for central part, σcentral. Black dashed box represents the central region within the whole tissue.
Figure 1
Figure 1. Extrusion correlates with singularities in cell orientation (+1/2 defects) in the epithelia.
a, (left) Schematics of confluent monolayer and extruding cell (grey: cell body, blue: nucleus, orange: apoptotic extruding cell). (middle) Side view confocal image of confluent MDCK monolayer and extruding cell (green - actin, blue - nucleus). (right) Corresponding images of activation of caspase-3 signal (red). b, Phase-contrast images showing monolayer dynamics before extrusion (yellow arrowhead) at t = 0 min, overlaid with velocity field vectors. Length of vectors is proportional to their magnitude. c, d, Corresponding images overlaid with red lines (represented as black lines in panel below) showing average local orientation of cells. The group of cells moving toward the extrusion forms comet-like configuration (blue dot: comet core, arrow: comet tail-to-head direction). e, Experimental and schematic images of +1/2 defect (top – comet configuration) and -1/2 defect (bottom – triangle configuration). Red lines denote average cell orientations, blue dot and arrow represent defect core and tail-to-head direction of +1/2 defect. Green triangle represents -1/2 defect core. f, (left) Schematic: determination of correlation between +1/2 defects and extrusions: distance, re of each extrusion to its closest +1/2 defect in the preceding frame is measured, and the number of these defects per unit area as function of re is normalized (right). See Methods. n = 50 (MDCK, WT) extrusions from 4 independent movies in 3 independent experiments, n = 61 (MDCK, mytomycin-c treatment) extrusions from 3 independent movies in 2 independent experiments, n = 85 (MCF10A) extrusions in 2 independent movies, n = 79 (HaCaT) extrusions in 2 independent movies. Scale bars, 10 μm.
Figure 2
Figure 2. MDCK WT epithelia behaves as a 2D, extensile, active nematic liquid crystal.
a, Average yy- and xy- component of strain rate map around +1/2 defect in experiments and corresponding average velocity flow field (n = 2142 defects from 4 independent movies in 3 independent experiments), compared with simulation of extensile, active nematic liquid crystal. Color code is positive for stretching and negative for shrinkage. b, Time evolution of (total) defect areal density under 50 μM blebbistatin treatment and washout (arrow). Data for each time point is binned over duration of 120 min (n = 6 different time frames), in n = 4 independent movies. t-test for each time point against time = 600 min. Data are represented as mean ± standard error of the mean (s.e.m.). **P < 0.01, ***P < 0.001. c, Schematic of TFM setup to measure traction (tx and ty) and to infer monolayer 2D stress (σxx, σyy and σxy). d, Average yy- and xy- component of stress map around a +1/2 defect in experiments (n = 1339 defects in 2 independent experiments), compared with simulation of extensile, active nematic liquid crystal. Color code is positive for tensile stress and negative for compressive stress. Overlaid black lines in panels show representative nematic directors, grey circle denotes defect core.
Figure 3
Figure 3. Compressive stresses at +1/2 defects trigger cell extrusion and YAP mechanosensitive response, and can be modulated by cell-cell junction strength.
a, Average isotropic stress around + and -1/2 defect in experiments (n = 1339 (+1/2) defects in 2 independent experiments, n = 2454 (-1/2) defects in 2 independent experiments), and simulations. Color code, positive for tensile state, negative for compression. b, Average isotropic stress around cells to extrude at t = 0 min with negative values (spatially averaged over 65*65 μm2; n = 32 extrusions in 2 independent experiments). t-test for each time point against normal distribution centered at zero. *P < 0.0001. c, Isotropic stress around a +1/2 defect flowing to top left corner of image, and extrusion. d, Nucleus and YAP distribution of cells at a +1/2 defect. Green arrowheads: cells with YAP in cytoplasm. e, Percentage of cells with YAP in nucleus, cytoplasm or uniformly distributed, at either+1/2 defects head, -1/2 defects core or random points. n = 78 (+1/2), n = 77 (-1/2), n = 78 (random) from 17 independent movies in 2 independent experiments. See Methods. Data represented as minimum, first and third quartiles, median, maximum (lines) and mean (circle). ks-test, ***P < 0.001. f, Average isotropic stress around +1/2 defect (α-catKD experiments). n = 1940 defects from 3 independent movies. Similar color code as (a). g, h, Average defect areal density and extrusion rate in WT and α-catKD MDCK. (g) n = 685 frames from 3 independent movies in 2 independent experiments (WT), n = 360 frames from 3 independent movies (α-catKD). Two sample t-test, ***P < 0.001. (h) n = 6 independent movies in 4 independent experiments (WT), n = 6 independent movies in 2 independent experiments (α-catKD). ks-test, **P < 0.01. All data, except (e), represented as mean ± s.e.m. Black lines show representative nematic directors, grey circle denotes defect core. Red lines show local cell orientation. Scale bars, 10 μm.
Figure 4
Figure 4. Topologically induced +1/2 defects can control extrusion hotspots.
a, d, Confluent MDCK monolayer confined on star and circle shape. Scale bar, 100 μm. Red lines show local cell orientation. b, e, Heat map of normalized extrusion number per unit area. c, f, Normalized, average areal density of extrusions, +1/2 defects and -1/2 defects as function of distance from confinement center, rfc. Each point on the curve is averaged over full 360° for each specific range of rfc. n = 145 extrusions, n = 6738 (+1/2) defects and n = 5083 (-1/2) defects from 12 independent movies in 2 independent experiments (star). n = 361 extrusions, n = 5389 (+1/2) defects and n = 4858 (-1/2) defects from 8 independent movies in 3 independent experiments (circle). g, Schematic of laser induction of single cell apoptosis. h, Time evolution of average number of +1/2 defects within radius of 80 μm around laser induced cell apoptosis (laser induction at t = 0 min, n = 9 independent apoptotic induction experiments). ks-test for each time point against t = 0 min, p-values for t = 50 – 300 min are respectively P = 0.86, 0.74, 0.81, 0.75, 0.30, and 0.73. Data represented as mean ± s.e.m. i, Schematic of apoptotic cell extrusion induced by nematic defect.

Comment in

References

    1. Rosenblatt J, Raff MC, Cramer LP. An epithelial cell destined for apoptosis signals its neighbors to extrude it by an actin-and myosin-dependent mechanism. Curr Biol. 2001;11:1847–1857. - PubMed
    1. Hogan C, et al. Characterization of the interface between normal and transformed epithelial cells. Nat Cell Biol. 2009;11:460–467. - PubMed
    1. Wagstaff L, et al. Mechanical cell competition kills cells via induction of lethal p53 levels. Nat Commun. 2016;7 - PMC - PubMed
    1. Marinari E, et al. Live-cell delamination counterbalances epithelial growth to limit tissue overcrowding. Nature. 2012;484:542–545. - PubMed
    1. Eisenhoffer GT, et al. Crowding induces live cell extrusion to maintain homeostatic cell numbers in epithelia. Nature. 2012;484:546–549. - PMC - PubMed