

50-nm-resolution full-field X-ray microscope without chromatic aberration using total-reflection imaging mirrors
- PMID: 28406227
- PMCID: PMC5390314
- DOI: 10.1038/srep46358
50-nm-resolution full-field X-ray microscope without chromatic aberration using total-reflection imaging mirrors
Abstract
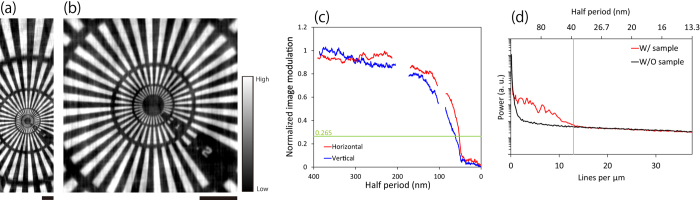
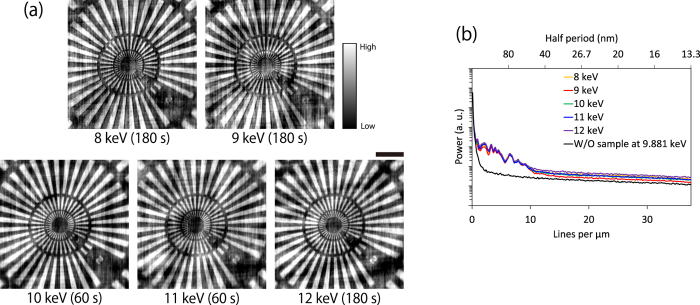
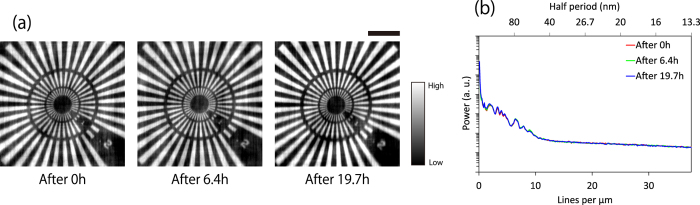
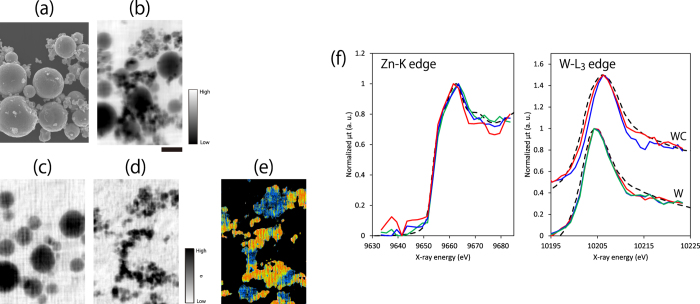
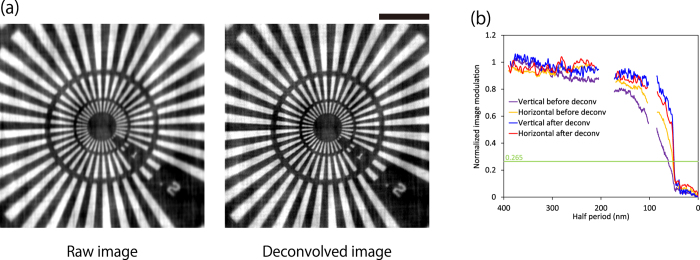
X-ray spectromicroscopy with a full-field imaging technique is a powerful method for chemical analysis of heterogeneous complex materials with a nano-scale spatial resolution. For imaging optics, an X-ray reflective optical system has excellent capabilities with highly efficient, achromatic, and long-working-distance properties. An advanced Kirkpatrick-Baez geometry that combines four independent mirrors with elliptic and hyperbolic shapes in both horizontal and vertical directions was developed for this purpose, although the complexity of the system has a limited applicable range. Here, we present an optical system consisting of two monolithic imaging mirrors. Elliptic and hyperbolic shapes were formed on a single substrate to achieve both high resolution and sufficient stability. The mirrors were finished with a ~1-nm shape accuracy using elastic emission machining. The performance was tested at SPring-8 with a photon energy of approximately 10 keV. We could clearly resolve 50-nm features in a Siemens star without chromatic aberration and with high stability over 20 h. We applied this system to X-ray absorption fine structure spectromicroscopy and identified elements and chemical states in specimens of zinc and tungsten micron-size particles.
Conflict of interest statement
The authors declare no competing financial interests.
Figures
References
-
- Hocke R. Micrographia: or, Some physiological descriptions of minute bodies made by magnifying glasses (London: J. Martyn and J. Allestry, 1665).
-
- Takahashi Y. et al.. High-resolution diffraction microscopy using the plane-wave field of a nearly diffraction limited focused x-ray beam. Phys. Rev. B 80, 054103 (2009).
-
- Vila-Comamala J. et al.. Characterization of high-resolution diffractive X-ray optics by ptychographic coherent diffractive imaging. Opt. Express 19, 21333 (2011). - PubMed
-
- Mimura H. et al.. Breaking the 10 nm barrier in hard-X-ray focusing. Nature Physics 6, 122–125 (2010).
-
- Yamauchi K. et al.. Single-nanometer focusing of hard x-rays by Kirkpatrick-Baez mirrors. J. Phys. Condens. Matter 23, 394206 (2011). - PubMed
Publication types
MeSH terms
LinkOut - more resources
Full Text Sources
Other Literature Sources
