. 2017 Jun;45(12):1570-1585.
doi: 10.1111/ejn.13582. Epub 2017 May 8.

Acetylcholine modulates gamma frequency oscillations in the hippocampus by activation of muscarinic M1 receptors

Affiliations

Acetylcholine modulates gamma frequency oscillations in the hippocampus by activation of muscarinic M1 receptors

Ruth T Betterton et al. Eur J Neurosci. 2017 Jun.

Abstract

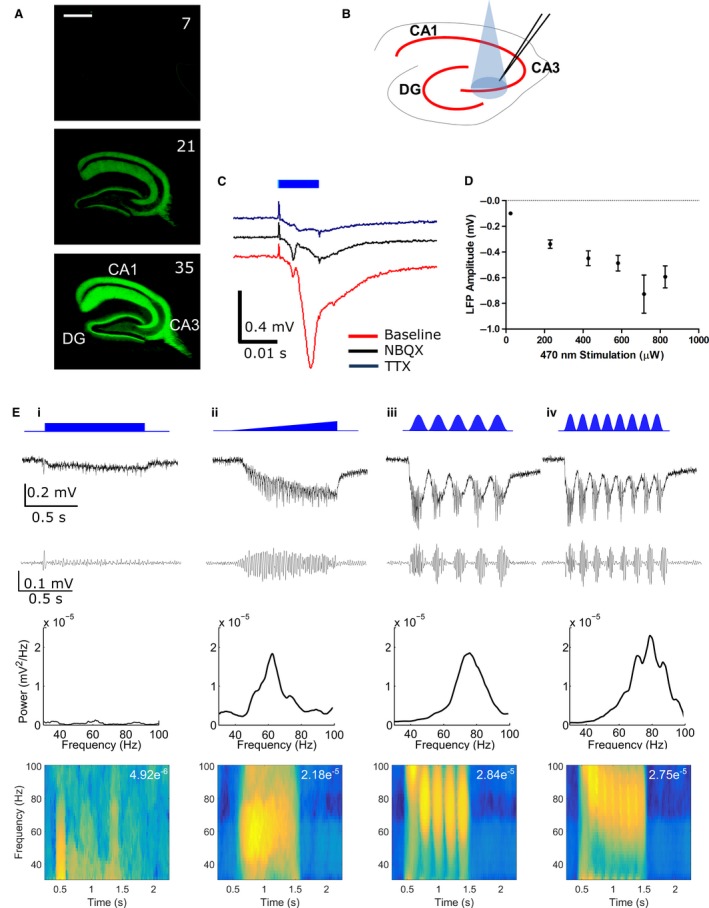
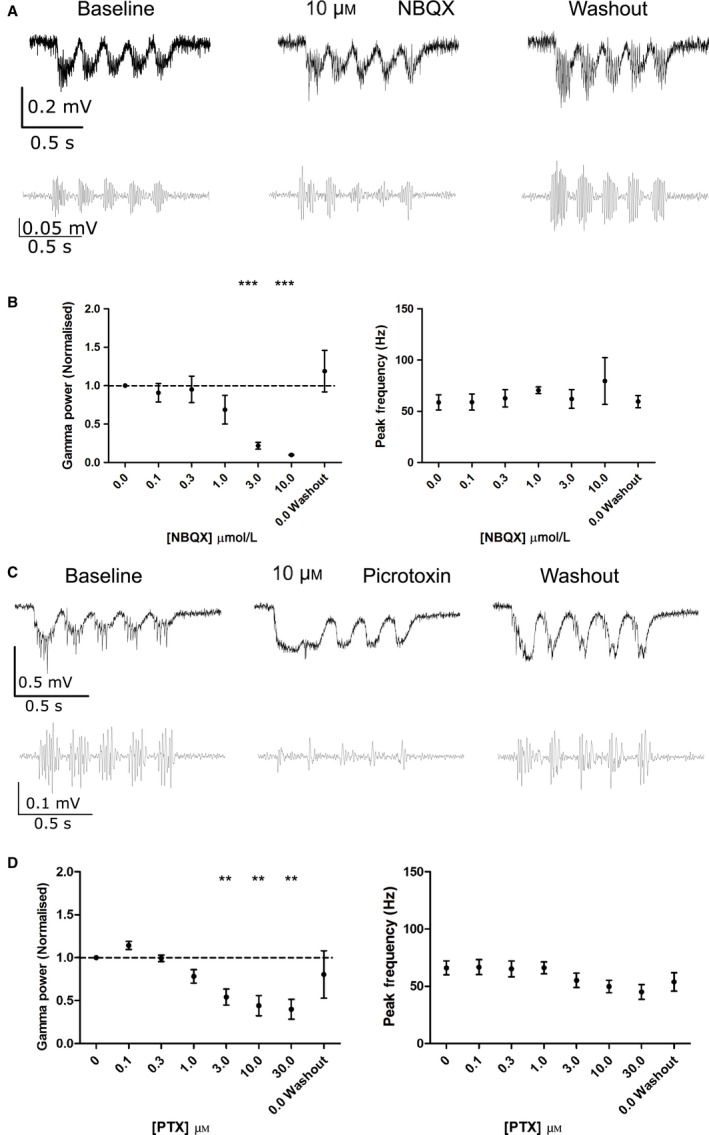
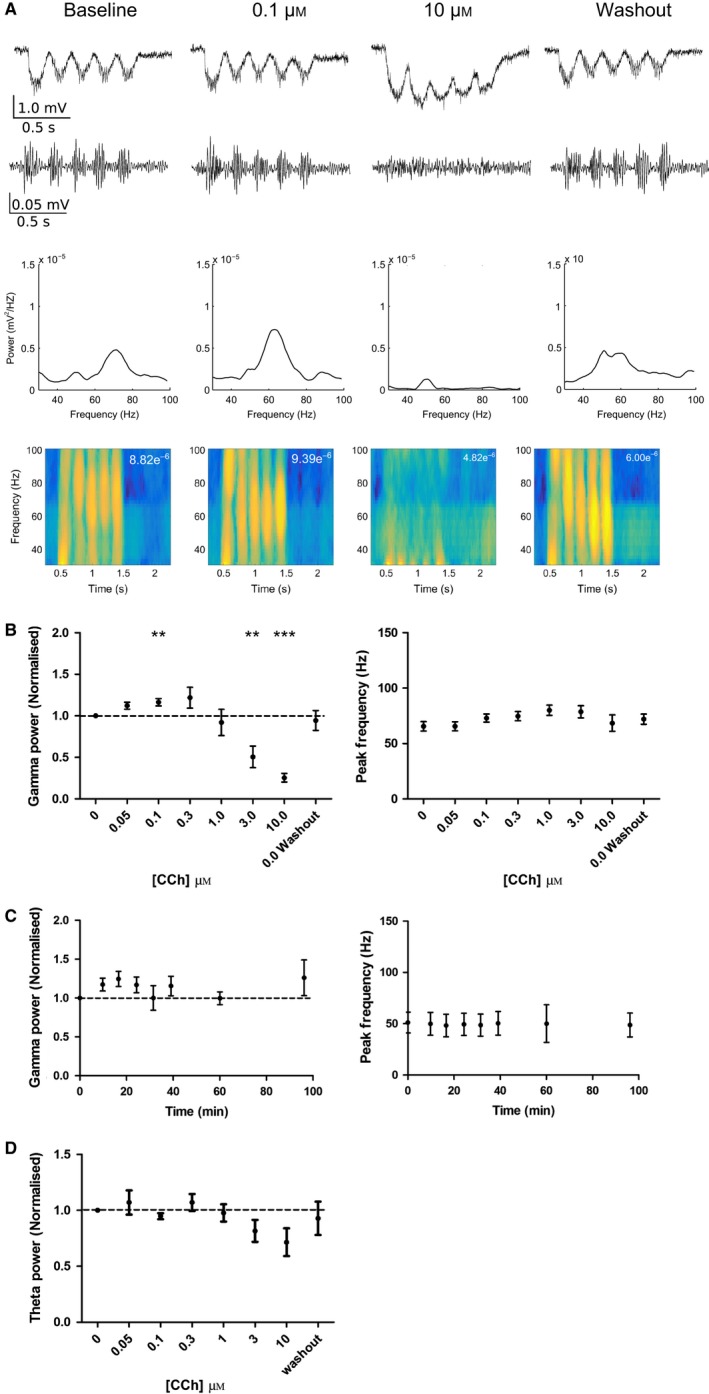
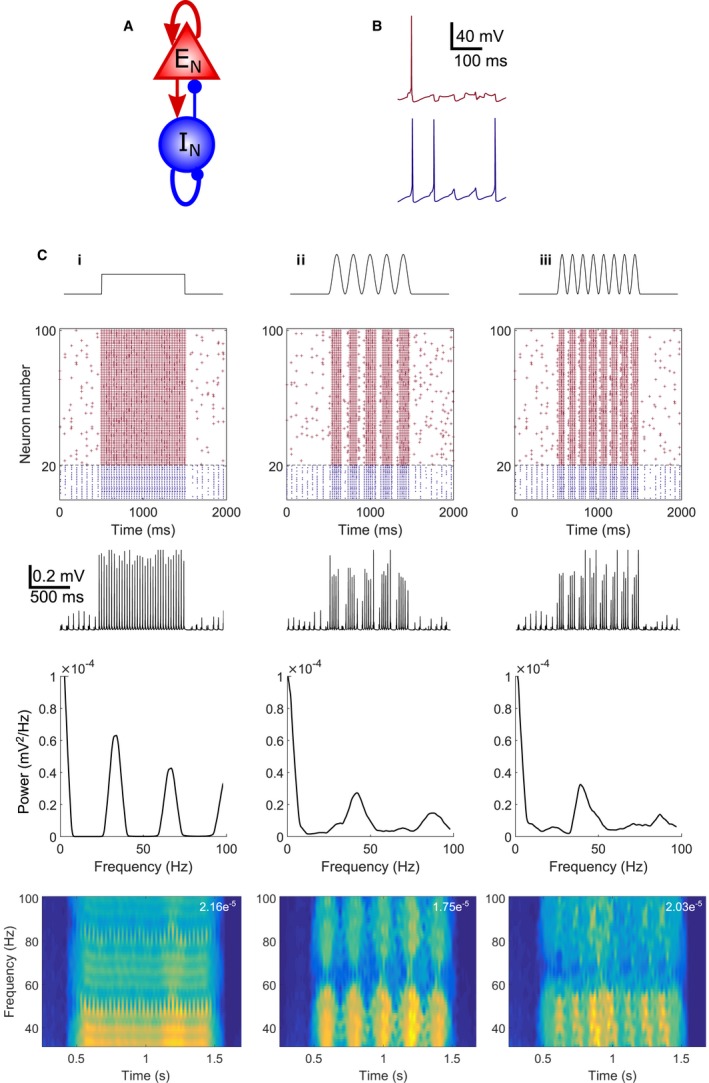
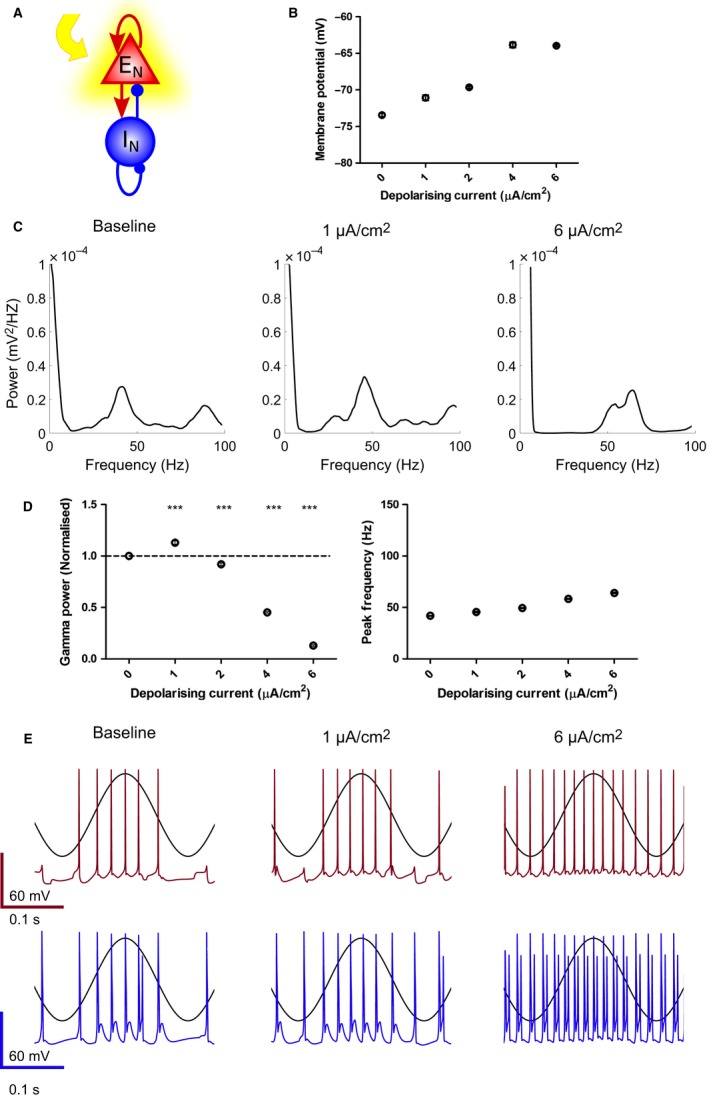
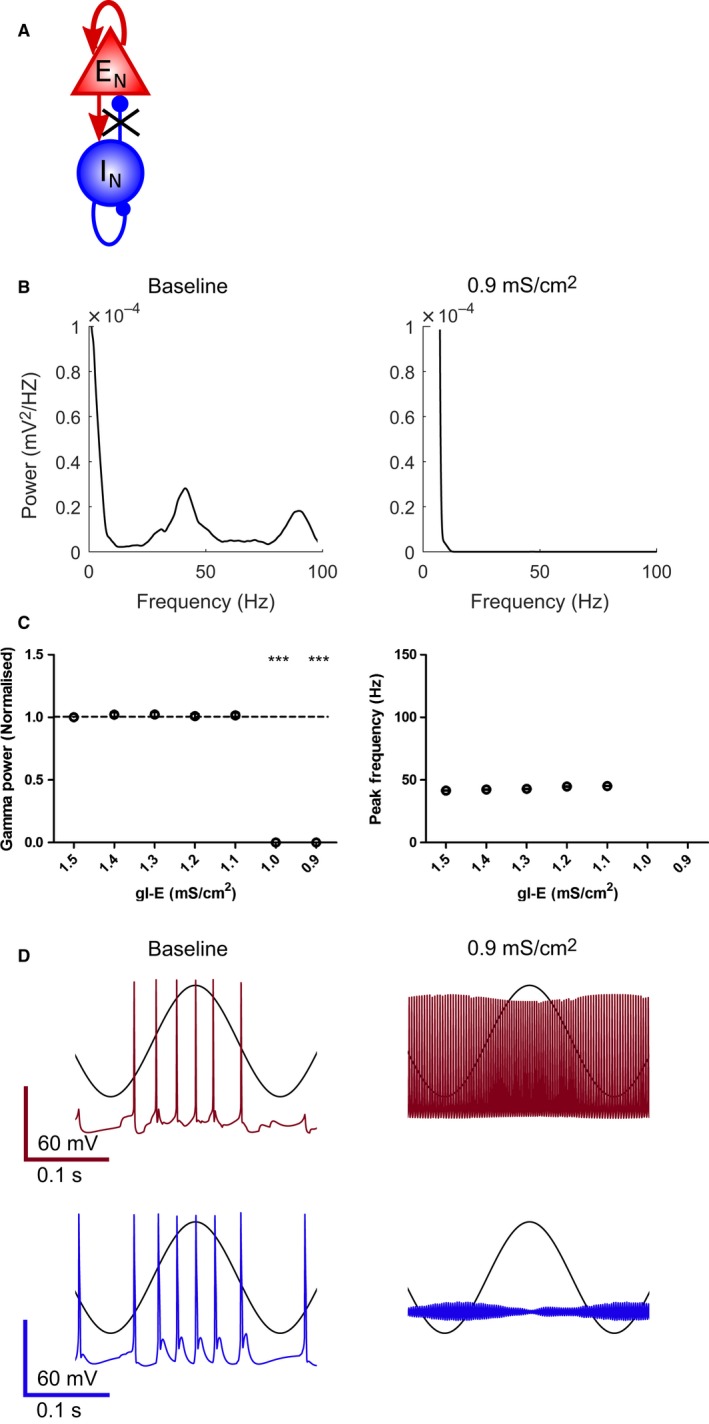
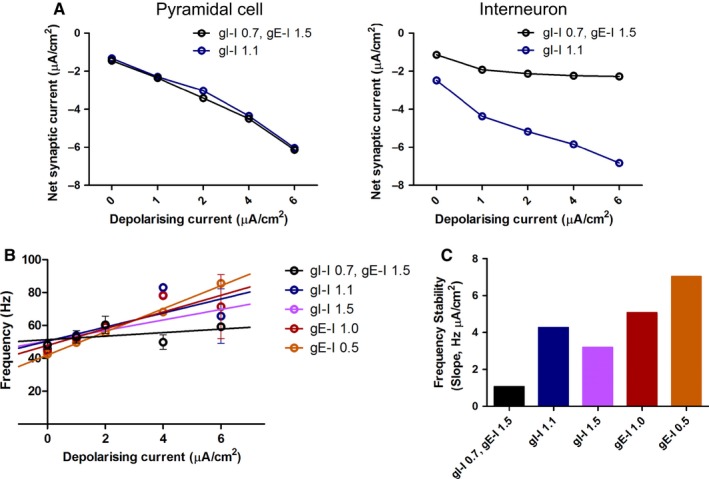
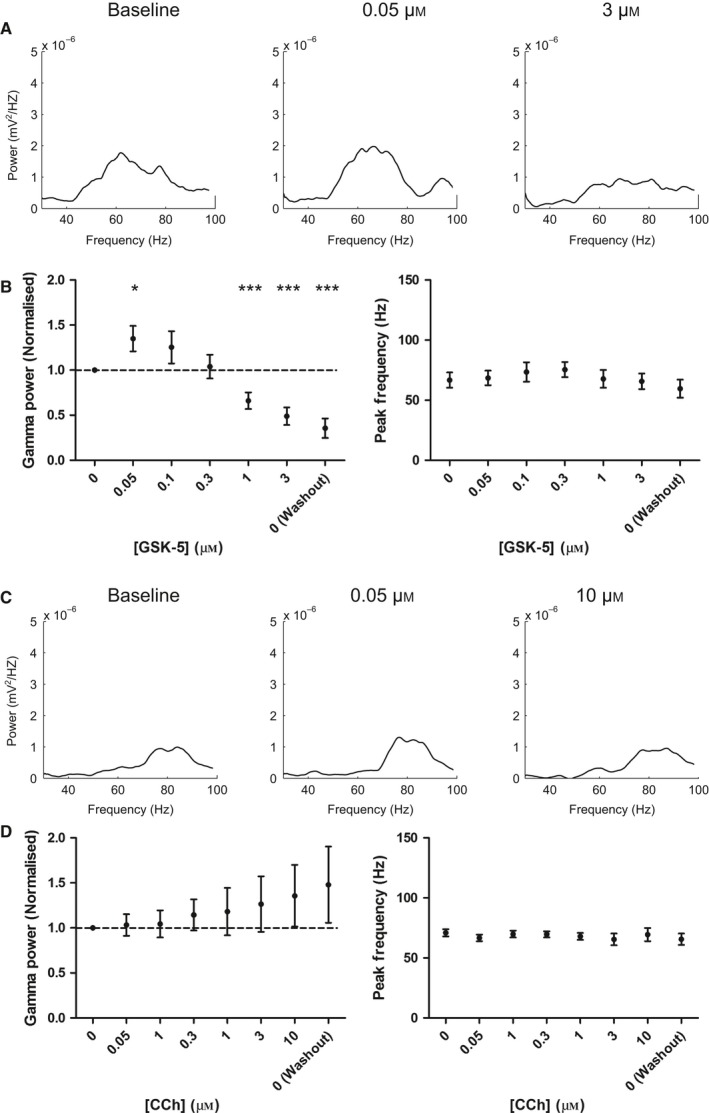
Modulation of gamma oscillations is important for the processing of information and the disruption of gamma oscillations is a prominent feature of schizophrenia and Alzheimer's disease. Gamma oscillations are generated by the interaction of excitatory and inhibitory neurons where their precise frequency and amplitude are controlled by the balance of excitation and inhibition. Acetylcholine enhances the intrinsic excitability of pyramidal neurons and suppresses both excitatory and inhibitory synaptic transmission, but the net modulatory effect on gamma oscillations is not known. Here, we find that the power, but not frequency, of optogenetically induced gamma oscillations in the CA3 region of mouse hippocampal slices is enhanced by low concentrations of the broad-spectrum cholinergic agonist carbachol but reduced at higher concentrations. This bidirectional modulation of gamma oscillations is replicated within a mathematical model by neuronal depolarisation, but not by reducing synaptic conductances, mimicking the effects of muscarinic M1 receptor activation. The predicted role for M1 receptors was supported experimentally; bidirectional modulation of gamma oscillations by acetylcholine was replicated by a selective M1 receptor agonist and prevented by genetic deletion of M1 receptors. These results reveal that acetylcholine release in CA3 of the hippocampus modulates gamma oscillation power but not frequency in a bidirectional and dose-dependent manner by acting primarily through muscarinic M1 receptors.

Keywords: acetylcholine; gamma oscillations; hippocampus; muscarinic M1 receptors.


Figures

Figure 1
Figure 1
Optogenetic induction of gamma oscillations. (A) Expression of ChR2‐EYFP over time (d.p.i. in top left of each image) after injection of rAAV5‐CaMKIIa‐hChR2 (H134R)‐EYFP virus into CA3 region. Scale bar is 500 μm. (B) Schematic diagram illustrating recording electrode placement within stratum radiatum in CA3 of acute hippocampal slice. (C) Example LFP responses to 10 ms light stimulation (470 nm, 581 μW) during control and following NBQX (10 μm) or TTX (1 μm) application. (D) Amplitude of the LFP response plotted against light intensity (n = 10 slices from eight animals). (E) Comparison of optogenetic protocols for induction of gamma oscillations. First row: Schematic of light stimulation protocol. Column i: 1 s step; column ii: 1 s ramp; column iii: 5 Hz sine wave; column iv: 8 Hz sine wave. Subsequent rows show unfiltered LFP, LFP bandpass filtered between 30 and 100 Hz, power spectral density plots and spectrograms (maximum power given in top right). Data shown are from a single slice. [Colour figure can be viewed at wileyonlinelibrary.com].
Figure 2
Figure 2
Inhibition of excitatory and inhibitory synaptic connections reduces the power of theta‐nested gamma oscillations. (A) Example unfiltered (top) and bandpass filtered (bottom) LFP traces showing response to 5 Hz sinusoidal light stimulation before, during and after NBQX (10 μm). (B) Gamma oscillation power but not peak frequency was reduced by NBQX at concentrations of 3 and 10 μm (n = 9 slices from six animals; P = 5.89 × 10−5 and 1.92 × 10−8 compared to baseline for 3 and 10 μm, respectively, P > 0.05 for all other concentrations). (C) Example unfiltered (top) and bandpass filtered (bottom) LFP traces showing response to 5 Hz sinusoidal light stimulation before, during and after picrotoxin (PTX, 10 μm). (D) Gamma oscillation power but not peak frequency was reduced by picrotoxin at concentrations of 3, 10 and 30 μm (n = 8 slices from six animals; P = 0.00265, 0.00204 and 0.00349 compared to baseline for 3, 10 and 30 μm, respectively, P > 0.05 for all other concentrations). **P < 0.01, ***P < 0.001.
Figure 3
Figure 3
Carbachol induces a dose‐dependent bidirectional change in the power of theta‐nested gamma oscillations. (A) Example unfiltered (top) and bandpass filtered (2nd row) LFP traces showing response to 5 Hz sinusoidal light stimulation before, during and after carbachol (0.1 and 10 μm). Power spectral density plots and spectrograms (maximum power given in top right) are shown below for an example experiment. (B) Gamma oscillation power but not peak frequency was increased at low concentrations (0.1 μm) of carbachol but reduced at higher concentrations (3 and 10 μm) (n = 11 slices from nine animals; P = 0.00383, 0.00350 and 5.950 × 10−8 compared to baseline for 0.1, 3 and 10 μm, respectively, P > 0.05 for all other concentrations). (C) Gamma oscillation power and peak frequency were unchanged in time‐matched control experiments (n = 4 slices from three animals; > 0.05 for all time points). (D) Theta oscillation power was not changed by any concentration of carbachol (n = 11 slices from nine animals; P > 0.05 for all concentrations). **P < 0.01, ***P < 0.001. [Colour figure can be viewed at wileyonlinelibrary.com].
Figure 4
Figure 4
Theta‐nested gamma oscillations in a biophysical network model. (A) Schematic representation for model connectivity between excitatory (EN) and inhibitory (IN) neurons. (B) Spiking characteristics of excitatory (top, red) and inhibitory (bottom, blue) neurons within the network. (C) Network behaviour in response to step (Ci) or 5 Hz (Cii) or 8 Hz (Ciii) input to excitatory cells with maximal amplitude 2.5 μA/cm2. First row: Schematic of current injection protocol; second row: raster plot of spiking for a network of 80 excitatory (red) and 20 inhibitory (blue) neurons; third row: LFP; fourth row: power spectral density plots; fifth row: spectrograms (maximum power given in top right). [Colour figure can be viewed at wileyonlinelibrary.com].
Figure 5
Figure 5
Modelling the effect of M1 mAChR activation on gamma oscillations. (A) Schematic representation of depolarising current given to excitatory neurons within the network to model the action of M1 mAChRs. (B) Increasing the amount of current injection depolarised pyramidal neurons in the mathematical model. (C) Power spectral density plots for increasing current injections. (D) Gamma oscillation power was increased at low current injection (1 μA/cm2), but reduced at higher current injections (4 and 6 μA/cm2) (n = 7; P = 2.24 × 10−4, 5.09 × 10−4, 7.82 × 10−10 and 5.56 × 10−11 compared to baseline for 1, 2, 4, 6 and 8 μA/cm2, respectively). (E) Example spiking output during sinusoidal input to pyramidal cells (black trace overlaid) for excitatory (top) and inhibitory (bottom) neurons over the range of constant current injections given to pyramidal neurons. ***P < 0.001. [Colour figure can be viewed at wileyonlinelibrary.com].
Figure 6
Figure 6
Modelling the effect of M2 mAChR activation on gamma oscillations. (A) Schematic representation of reduction in inhibitory–excitatory synaptic conductance (gI‐E) within the network to model the action of M2 mAChRs. (B) Power spectral density plots for reduced gI‐E. (C) Gamma oscillation power was decreased for reduced gI‐E (1.0 and 0.9 mS/cm2) (n = 7; P = 1.59 × 10−25 and 1.37 × 10−23 compared to baseline for 1.0 and 0.9 mS/cm2, respectively). (D) Example spiking output during sinusoidal input to pyramidal cells (black trace overlaid) for excitatory (top) and inhibitory (bottom) neurons over the range of gI‐E. ***P < 0.001. [Colour figure can be viewed at wileyonlinelibrary.com].
Figure 7
Figure 7
Gamma oscillation frequency stability is governed by synaptic input to interneurons. (A) Net synaptic current density (excitatory synapses are characterised by positive current and vice versa) during modelled gamma oscillations induced by theta‐frequency stimulation became more strongly negative in pyramidal cells (PCs; left) but less so in interneurons (right) as the constant depolarising current increased. Increasing inhibitory‐to‐inhibitory conductance, gI‐I, from 0.7 mS/cm2 to 1.1 mS/cm2 produced no change in net synaptic current density in PCs, but became more negative in interneurons particularly with large constant depolarising current. (B) Gamma oscillation frequency was less stable across a range of constant current injections when excitatory–inhibitory synaptic balance was reduced. In control conditions (gI‐I = 0.7 mS/cm2, gE‐I = 1.5 mS/cm2), gamma oscillation frequency increased only slightly with applied depolarising current (fitted plots (left) and slopes (right)). When E‐I balance was altered by either increasing gI‐I or reducing gE‐I gamma oscillation frequency increased strongly with applied depolarising current (n = 7; P = 8.71 × 10−3, 6.77 × 10−4, 5.10 × 10−3, 2.54 × 10−8 for slope comparison control to gI‐I = 1.1 mS/cm2, gI‐I = 1.5 mS/cm2, gE‐I = 1.0 mS/cm2, gE‐I = 0.5 mS/cm2, respectively). [Colour figure can be viewed at wileyonlinelibrary.com].
Figure 8
Figure 8
M1 mAChRs are necessary and sufficient for the effects of carbachol on theta‐nested gamma oscillations. (A) Power spectral density plots for theta‐nested gamma oscillations with increasing concentrations of the M1 mAChR selective agonist GSK‐5. (B) Gamma oscillation power but not peak frequency was increased at low concentrations of GSK‐5 (0.05 μm), but reduced at higher concentrations (1 and 3 μm) (n = 9 slices from six animals; P = 0.0164, 5.90 × 10−3 and 7.83 × 10−4 compared to baseline for 0.05, 1 and 3 μm, respectively, P > 0.05 for 0.1 and 0.3 μm; P > 0.05 for peak frequency at all concentrations). (C) Power spectral density plots for theta‐nested gamma oscillations with increasing concentrations of carbachol in slices from M1 KO mice. (D) There was no effect of carbachol on gamma oscillation power or peak frequency at any concentration of carbachol (= 9 slices from six animals; P > 0.05 for gamma power and peak frequency at all concentrations). *P < 0.05, ***P < 0.001.

References

    1. Adesnik, H. & Scanziani, M. (2010) Lateral competition for cortical space by layer‐specific horizontal circuits. Nature, 464, 1155–1160. - PMC - PubMed
    1. Ainsworth, M. , Lee, S. , Cunningham, M.O. , Traub, R.D. , Kopell, N.J. & Whittington, M.A. (2012) Rates and rhythms: a synergistic view of frequency and temporal coding in neuronal networks. Neuron, 75, 572–583. - PubMed
    1. Akam, T. , Oren, I. , Mantoan, L. , Ferenczi, E. & Kullmann, D.M. (2012) Oscillatory dynamics in the hippocampus support dentate gyrus‐CA3 coupling. Nat. Neurosci., 15, 763–768. - PMC - PubMed
    1. Alkondon, M. & Albuquerque, E.X. (2001) Nicotinic acetylcholine receptor alpha7 and alpha4beta2 subtypes differentially control GABAergic input to CA1 neurons in rat hippocampus. J. Neurophysiol., 86, 3043–3055. - PubMed
    1. Anagnostaras, S.G. , Murphy, G.G. , Hamilton, S.E. , Mitchell, S.L. , Rahnama, N.P. , Nathanson, N.M. & Silva, A.J. (2003) Selective cognitive dysfunction in acetylcholine M1 muscarinic receptor mutant mice. Nat. Neurosci., 6, 51–58. - PubMed

Publication types