. 2017 Apr 13;13(4):e1006402.
doi: 10.1371/journal.pgen.1006402. eCollection 2017 Apr.

Gene co-expression network connectivity is an important determinant of selective constraint

Affiliations

Gene co-expression network connectivity is an important determinant of selective constraint

Niklas Mähler et al. PLoS Genet. .

Abstract

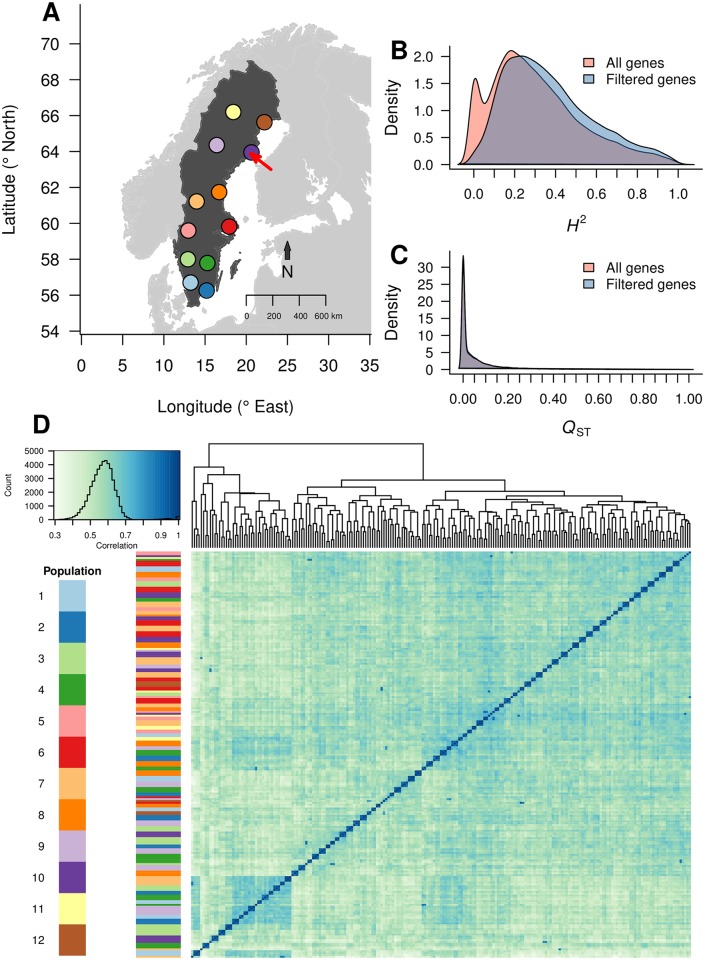
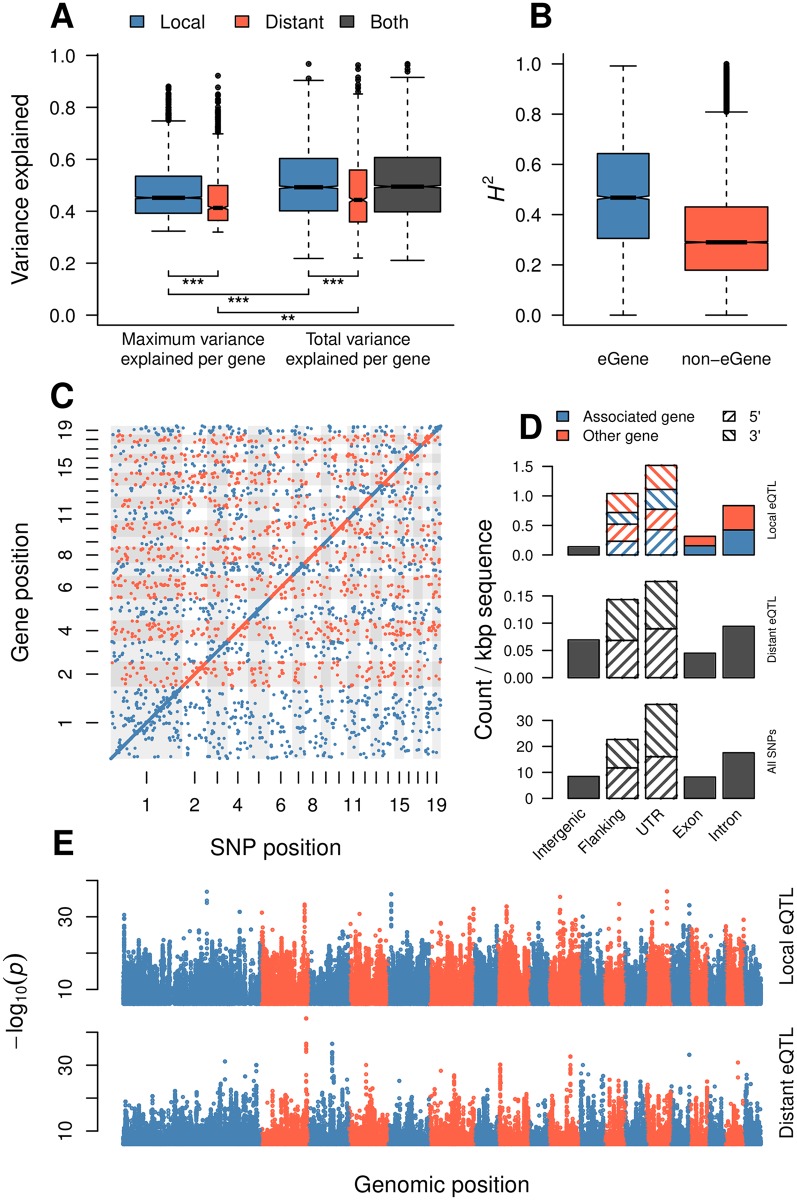
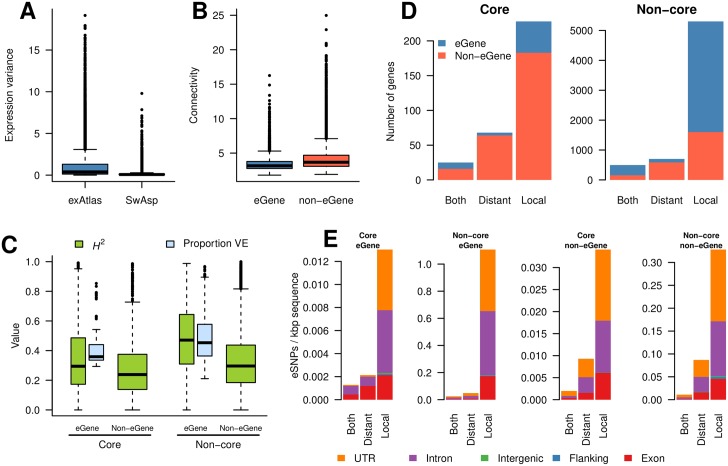
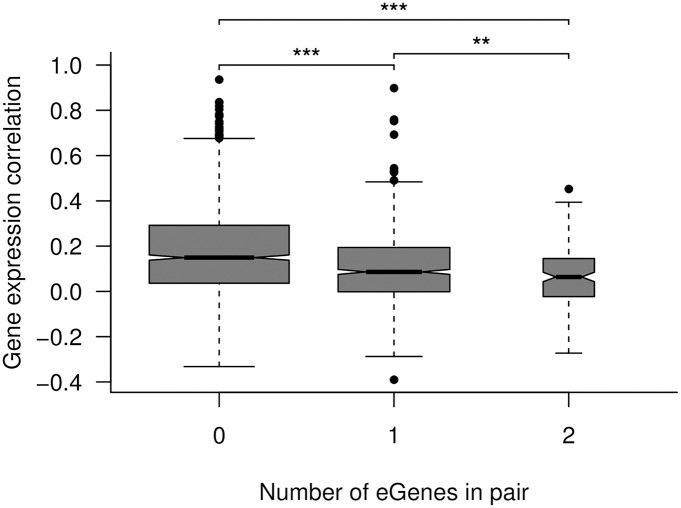
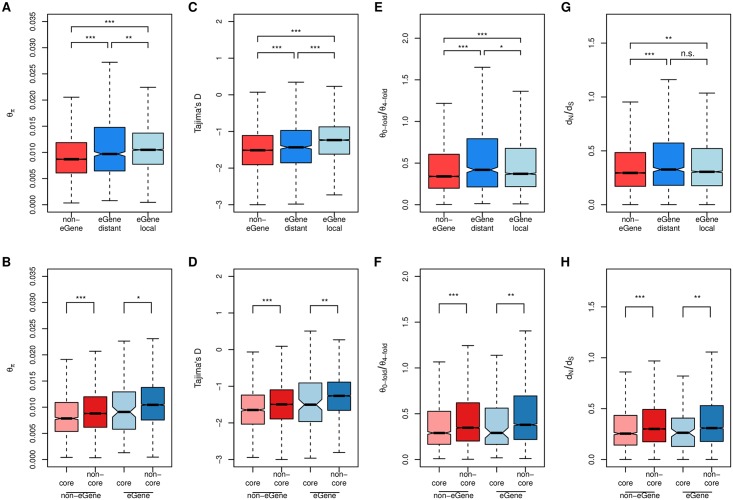
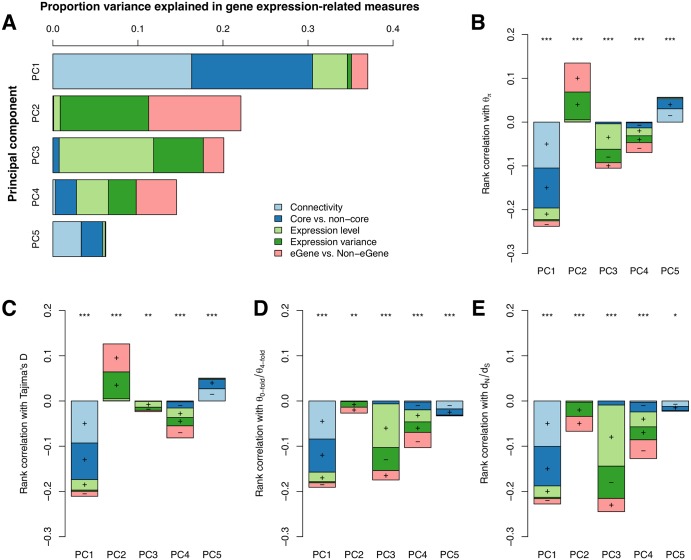
While several studies have investigated general properties of the genetic architecture of natural variation in gene expression, few of these have considered natural, outbreeding populations. In parallel, systems biology has established that a general feature of biological networks is that they are scale-free, rendering them buffered against random mutations. To date, few studies have attempted to examine the relationship between the selective processes acting to maintain natural variation of gene expression and the associated co-expression network structure. Here we utilised RNA-Sequencing to assay gene expression in winter buds undergoing bud flush in a natural population of Populus tremula, an outbreeding forest tree species. We performed expression Quantitative Trait Locus (eQTL) mapping and identified 164,290 significant eQTLs associating 6,241 unique genes (eGenes) with 147,419 unique SNPs (eSNPs). We found approximately four times as many local as distant eQTLs, with local eQTLs having significantly higher effect sizes. eQTLs were primarily located in regulatory regions of genes (UTRs or flanking regions), regardless of whether they were local or distant. We used the gene expression data to infer a co-expression network and investigated the relationship between network topology, the genetic architecture of gene expression and signatures of selection. Within the co-expression network, eGenes were underrepresented in network module cores (hubs) and overrepresented in the periphery of the network, with a negative correlation between eQTL effect size and network connectivity. We additionally found that module core genes have experienced stronger selective constraint on coding and non-coding sequence, with connectivity associated with signatures of selection. Our integrated genetics and genomics results suggest that purifying selection is the primary mechanism underlying the genetic architecture of natural variation in gene expression assayed in flushing leaf buds of P. tremula and that connectivity within the co-expression network is linked to the strength of purifying selection.


Conflict of interest statement

The authors have declared that no competing interests exist.

Figures

Fig 1
Fig 1. Population location and gene expression overview.
(A) Map of the original locations of the SwAsp populations. The red arrow points to the location of the common garden used in this study. (B) Distribution of gene expression heritability for all genes and for the subset of genes after filtering to remove uninformative expression. (C) Distribution of gene expression QST for all genes and for the subset of genes after filtering to remove uninformative expression. (D) Sample clustering based on all samples, including biological replicates. The heatmap represents the sample correlation matrix based on the 500 genes with the highest expression variance using gene expression data prior to hidden confounder removal. Darker colour indicates higher correlation. The coloured bar represents the populations the samples belong to. The small clusters on the diagonal correspond to biological replicates of each genotype.
Fig 2
Fig 2. eQTL overview.
(A) Expression variance explained (R2) for local and distant eQTLs. Box plots show the maximum variance explained by a single eQTL for each gene and the total variance explained by all eQTLs for each gene. The widths of the boxes are proportional to the number of genes represented. The pairwise significiance of a Mann-Whitney test is indicated by asterisks: ***p < 0.001, **p < 0.01. (B) Broad sense heritability distributions for eGenes and non-eGenes. (C) Scatter plot showing the positions of all significant eQTLs in this study. No evidence of eQTL hotspots can be observed. Numbers indicate chromosome. (D) Genomic context of local and distant eSNPs. Context categories are normalized for feature length. When an eSNP overlapped with features on both strands, both of them were counted. For both local and distant eQTLs the features are based on the gene that is closest to the eSNP, and furthermore, for local eQTLs, the features are divided into whether the eSNP is located in or near the same gene that it is associated to (“associated gene”) or not (“other gene”). Flanking regions represent 2 kbp upstream and downstream from the gene. (E) Manhattan plots for local eQTLs (upper) and distant eQTLs (lower). Each point represents an eQTL.
Fig 3
Fig 3. Co-expression characteristics of eGenes and eSNPs.
(A) Gene expression variance distribution for all genes in the SwAsp data (before removal of hidden confounders) and the exAtlas data. (B) Distribution of co-expression connectivity for eGenes and non-eGenes. (C) Distributions of the proportion of total variance explained and heritability for eGenes and non-eGenes divided into core and non-core genes. (D) Genes having distantly, locally, or both distantly and locally acting eSNPs located within 2 kbp (or inside) the gene divided into core and non-core genes. (E) Genomic context of distantly, locally, or both distantly and locally acting eSNPs located within 2 kbp of an eGene divided into core and non-core eGenes. The eSNP counts are normalised for total feature length.
Fig 4
Fig 4. Correlation within paralog pairs as a function of the number of eGenes in the paralog pair.
The widths of the boxes are proportional to the number of genes in each set. The mean correlations for paralog pairs with 0, 1, or 2 eGenes were 0.17, 0.10, and 0.06, respectively. The pairwise significance of a Mann-Whitney test is indicated by asterisks: ***p < 0.001, **p < 0.01.
Fig 5
Fig 5. Measures of sequence diversity and divergence.
Nucleotide diversity (A,B), Tajima’s D (C, D), θ0-fold4-fold (E,F) and dN/dS (G,H) are compared between eGenes (with local eQTLs or with only distant eQTLs) and non-eGenes, as well as core and non-core genes from the gene expression network. Significance between each pair of gene categories was evaluated using Mann-Whitney tests and significance is indicated by asterisks above the boxplot: ***p < 0.001, **p < 0.01, *p < 0.05, n.s. p >0.05.
Fig 6
Fig 6. Associations between metrics of gene expression and sequence evolution in Populus tremula.
(A) Percentage variance explained by five principal components comprising co-expression network connectivity, genes in network cores or not (Core vs. non-core genes), gene expression levels, gene expression variance and genes with eQTLs or not (eGenes vs. non-eGenes). Colour shadings depict the proportion contribution of each gene expression measure to each principal component. (B-E) Spearman’s rank correlations between PCs and four metrics of sequence evolution: nucleotide diversity (θπ), Tajima’s D, θ0-fold4-fold and dN/dS. Stacking of the barplots shows the relative contribution of each gene expression measure to each PC. Plus or minus indicates the direction of correlation for individual variable on the corresponding PCs. Asterisks indicate significant correlations, ***P < 1e-5, **P < 0.001,*P<0.05, ns = not significant (P >0.05).

References

    1. Ingvarsson PK, Hvidsten TR, Street NR. Towards integration of population and comparative genomics in forest trees. New Phytol. 2016; - PubMed
    1. Sandberg R, Yasuda R, Pankratz DG, Carter TA, Del Rio JA, Wodicka L, et al. Regional and strain-specific gene expression mapping in the adult mouse brain. Proc Natl Acad Sci U S A. 2000;97: 11038–43. - PMC - PubMed
    1. Primig M, Williams RM, Winzeler EA, Tevzadze GG, Conway AR, Hwang SY, et al. The core meiotic transcriptome in budding yeasts. Nat Genet. 2000;26: 415–423. 10.1038/82539 - DOI - PubMed
    1. Jin W, Riley RM, Wolfinger RD, White KP, Passador-Gurgel G, Gibson G. The contributions of sex, genotype and age to transcriptional variance in Drosophila melanogaster. Nat Genet. 2001;29: 389–95. 10.1038/ng766 - DOI - PubMed
    1. Oleksiak MF, Churchill GA, Crawford DL. Variation in gene expression within and among natural populations. Nat Genet. 2002;32: 261–266. 10.1038/ng983 - DOI - PubMed

Publication types

MeSH terms

LinkOut - more resources