. 2017 Apr 13;12(4):e0175758.
doi: 10.1371/journal.pone.0175758. eCollection 2017.

Reconstruction of 3D structures of MET antibodies from electron microscopy 2D class averages

Affiliations

Reconstruction of 3D structures of MET antibodies from electron microscopy 2D class averages

Qi Chen et al. PLoS One. .

Abstract

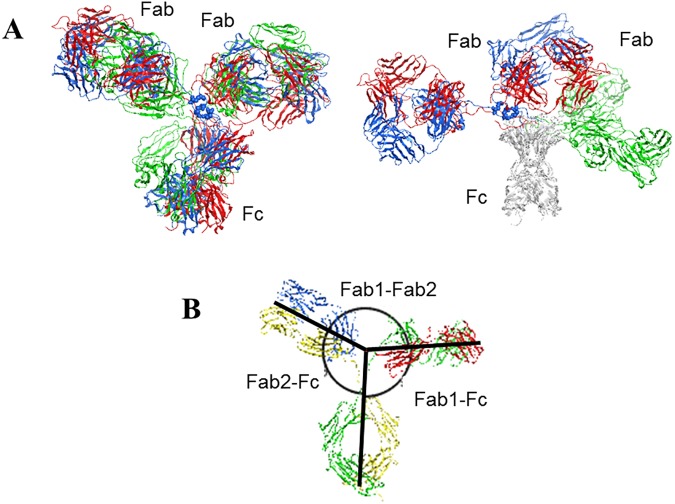
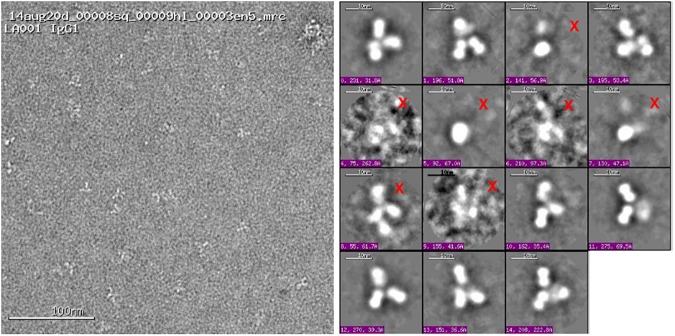
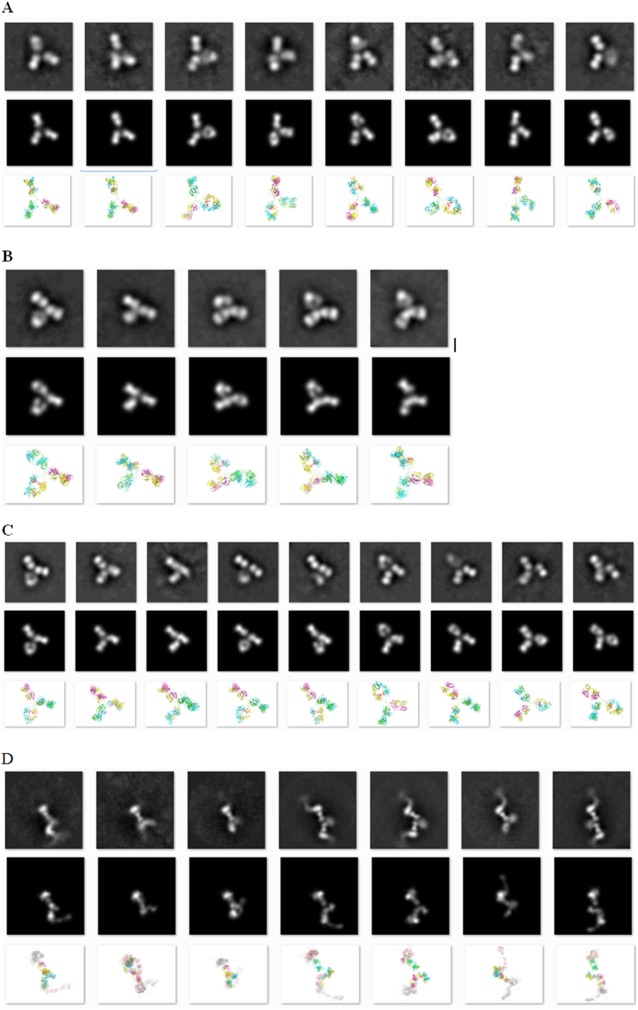
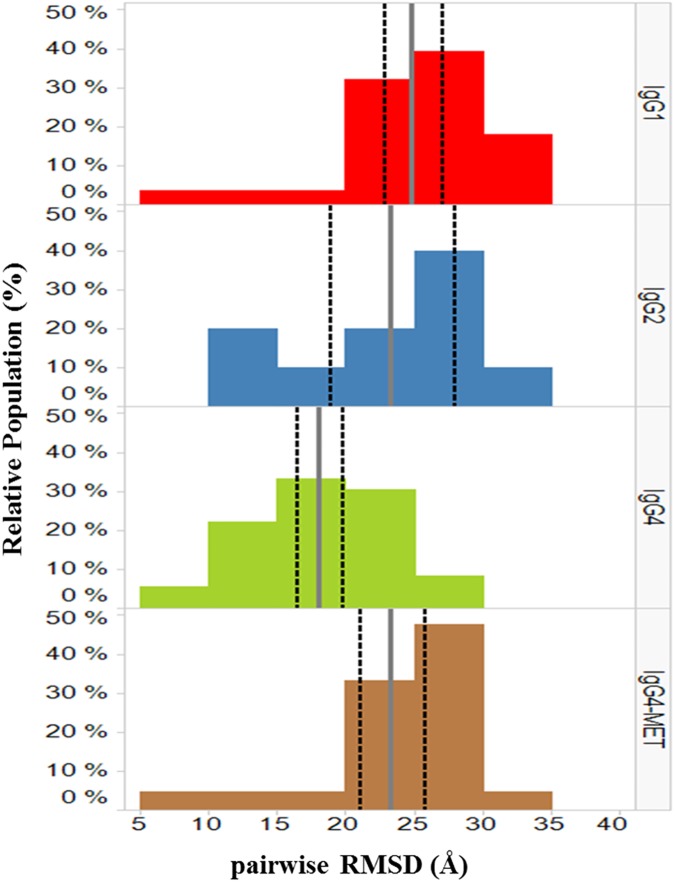
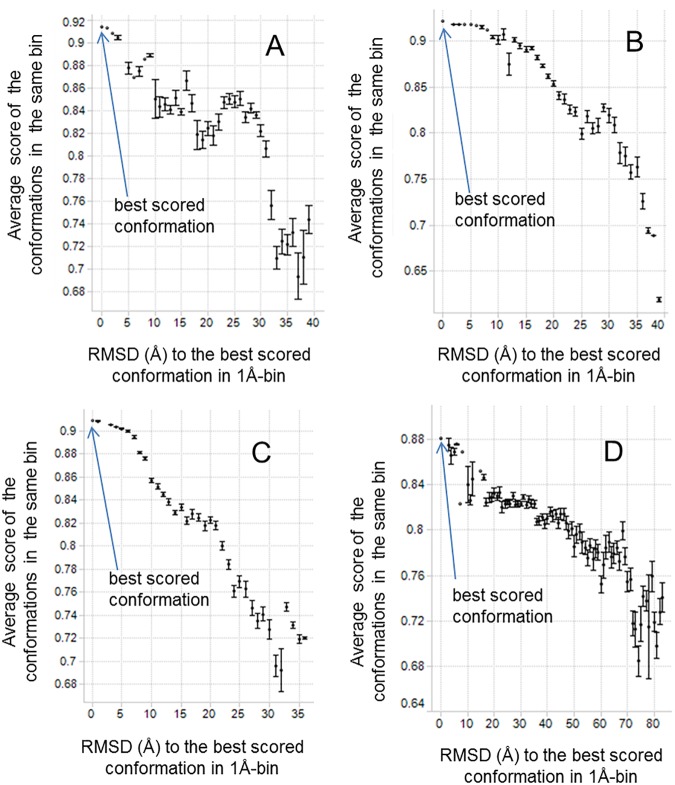
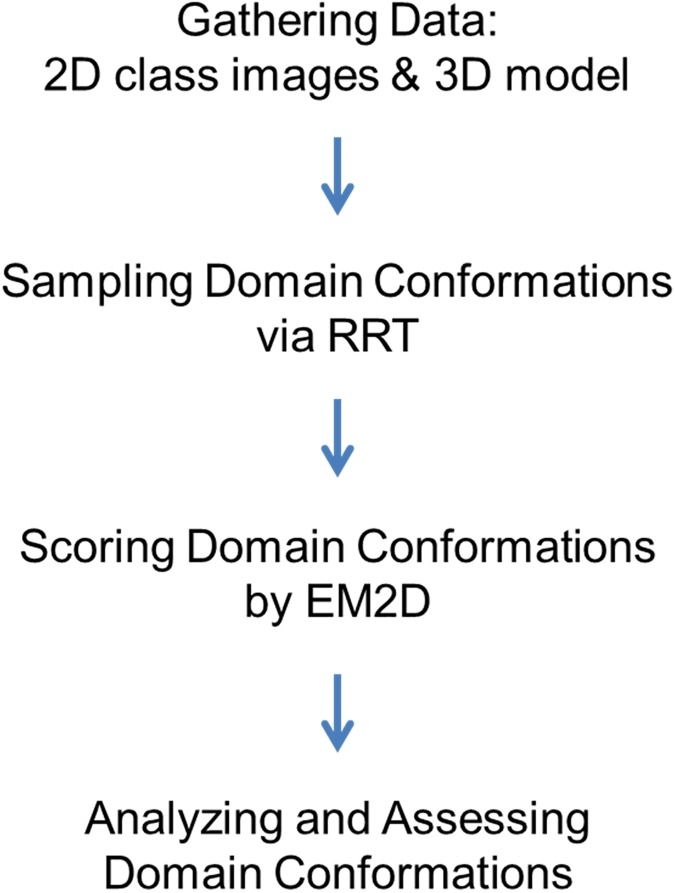
Dynamics of three MET antibody constructs (IgG1, IgG2, and IgG4) and the IgG4-MET antigen complex was investigated by creating their atomic models with an integrative experimental and computational approach. In particular, we used two-dimensional (2D) Electron Microscopy (EM) images, image class averaging, homology modeling, Rapidly exploring Random Tree (RRT) structure sampling, and fitting of models to images, to find the relative orientations of antibody domains that are consistent with the EM images. We revealed that the conformational preferences of the constructs depend on the extent of the hinge flexibility. We also quantified how the MET antigen impacts on the conformational dynamics of IgG4. These observations allow to create testable hypothesis to investigate MET biology. Our protocol may also help describe structural diversity of other antigen systems at approximately 5 Å precision, as quantified by Root-Mean-Square Deviation (RMSD) among good-scoring models.


Conflict of interest statement

Competing Interests: The IMP software development was funded in part by NIH grants to AS, including P41 GM109824 and R01 GM083960. IEC is supported by the NSF Graduate Student Research Fellowship. The affiliation of authors (QC, MV, DET, CH, WZ, JL, LL) with Eli Lilly and Company does not alter our adherence to PLOS ONE policies on sharing data and materials.

Figures

Fig 1
Fig 1. The antibody structure and variability.
(A) X-ray crystal structures of three full length antibodies: mouse IgG2 in blue (PDB code 1IGT) [3], human IgG1 in red (1HZH) [4], and mouse IgG1 in green (1IGY) [5], superposed on all aligned Cα atoms from all three domains (left) for the overall shape comparison or only Fc domains (right) to highlight the differences in Fab domains. The pairwise Cα RMSD values range from 20 to 34 Å with an average of 27.6 Å. The pairwise Cα RMSD values of the Fab domains range from 1.1 to 3.9 Å when superposed only on the Fab domain residues, with an average of 2.0 Å. The pairwise Cα RMSD values of the Fc domains range from 2.2 to 2.4 Å when superposed only on the Fc domain residues. Superposition was done using MOE 2014.09 [6]. (B) An example to show the definition of the domain angles between every two domains measured from 3D structures as described by Zhang et. al. [2]. The lines follow the longest axis of each domain.
Fig 2
Fig 2. The effect of MET antibody isotypes on pAKT in Caki-1 cells.
(A) The humanized IgG4 MET antibody (LY2875358), hIgG4 and mIgG1 induce weak phosphorylation of pan-AKT as compared to the strong phosphorylation of pan-AKT by agonist antibody 5D5 and HGF [12]. (B) Comparison of IgG1 (purple), IgG2 (blue) and IgG4 MET antibodies (red). (C) The sequences in the hinges. The numbering of the first residue is shown in each sequence. The inter-heavy-chain disulfide bonded cysteine residues are indicated in yellow boxes.
Fig 3
Fig 3. Examples of EM image thumbnails.
An EM micrograph with a number of IgG1 particles (left) and EM 2D class average images (right). Not all 2D class averages contained recognizable Y/T-shaped antibody particles; those marked by a red “X” were not used in modeling.
Fig 4
Fig 4. Observed class averages, resulting 3D models, and class averages computed from the models.
Images of observed 2D class average (first row), class averages computed from the resulting 3D models (second row) and the ribbon views from the 3D model (light chains in green and magenta, heavy chains in yellow and cyan, glycoside heavy atoms in red), and the models (second row). (A) IgG1: image dimension 160x160 pixels, 2.0 Å/pixel. (B) IgG2: image dimension 160x160 pixels, 2.0 Å/pixel. (C) IgG4: image dimension 106x106 pixels, 3.0 Å/pixel. (D) IgG4-MET antigen complex: image dimension 160x160 pixels, 3.24 Å/pixel.
Fig 5
Fig 5. Distributions of pairwise RMSD values for IgG1, IgG2, IgG4 and IgG4- MET complex models.
The average values of pairwise RMSD are indicated by the gray vertical solid bars. The 95% confidence intervals of the average are indicated by the black vertical dashed bars. The plots were created using TIBCO Spotfire 6.5.3.[16]
Fig 6
Fig 6. EM2D scores of all conformations and their RMSD values to the highest scoring conformation.
The conformations are binned into groups of 1 Å size according to the RMSD values. The standard error is shown as the error bar for each bin. The samples are (A) IgG1, (B) IgG2, (C) IgG4, and (D) IgG4 antigen complex.
Fig 7
Fig 7. Flowchart of integrative multi-state modeling.

References

    1. Lambert JM. Antibody-Drug Conjugates (ADCs): Magic Bullets at Last! Mol Pharm. 2015;12(6):1701–2. doi: 10.1021/acs.molpharmaceut.5b00302 - DOI - PubMed
    1. Zhang X, Zhang L, Tong H, Peng B, Rames MJ, Zhang S, et al. 3D Structural Fluctuation of IgG1 Antibody Revealed by Individual Particle Electron Tomography. Sci Rep. 2015;5:9803 doi: 10.1038/srep09803 - DOI - PMC - PubMed
    1. Harris LJ, Larson SB, Hasel KW, McPherson A. Refined structure of an intact IgG2a monoclonal antibody. Biochemistry. 1997;36(7):1581–97. doi: 10.1021/bi962514+ - DOI - PubMed
    1. Saphire EO, Parren PW, Pantophlet R, Zwick MB, Morris GM, Rudd PM, et al. Crystal structure of a neutralizing human IGG against HIV-1: a template for vaccine design. Science. 2001;293(5532):1155–9. doi: 10.1126/science.1061692 - DOI - PubMed
    1. Harris LJ, Skaletsky E, McPherson A. Crystallographic structure of an intact IgG1 monoclonal antibody. J Mol Biol. 1998;275(5):861–72. doi: 10.1006/jmbi.1997.1508 - DOI - PubMed

Substances

LinkOut - more resources