

Large inter-individual and intra-individual variability in the effect of perceptual load
- PMID: 28406997
- PMCID: PMC5391011
- DOI: 10.1371/journal.pone.0175060
Large inter-individual and intra-individual variability in the effect of perceptual load
Abstract
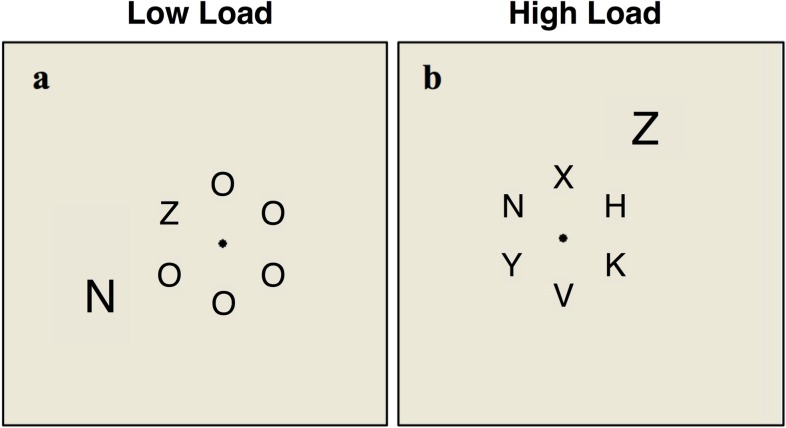
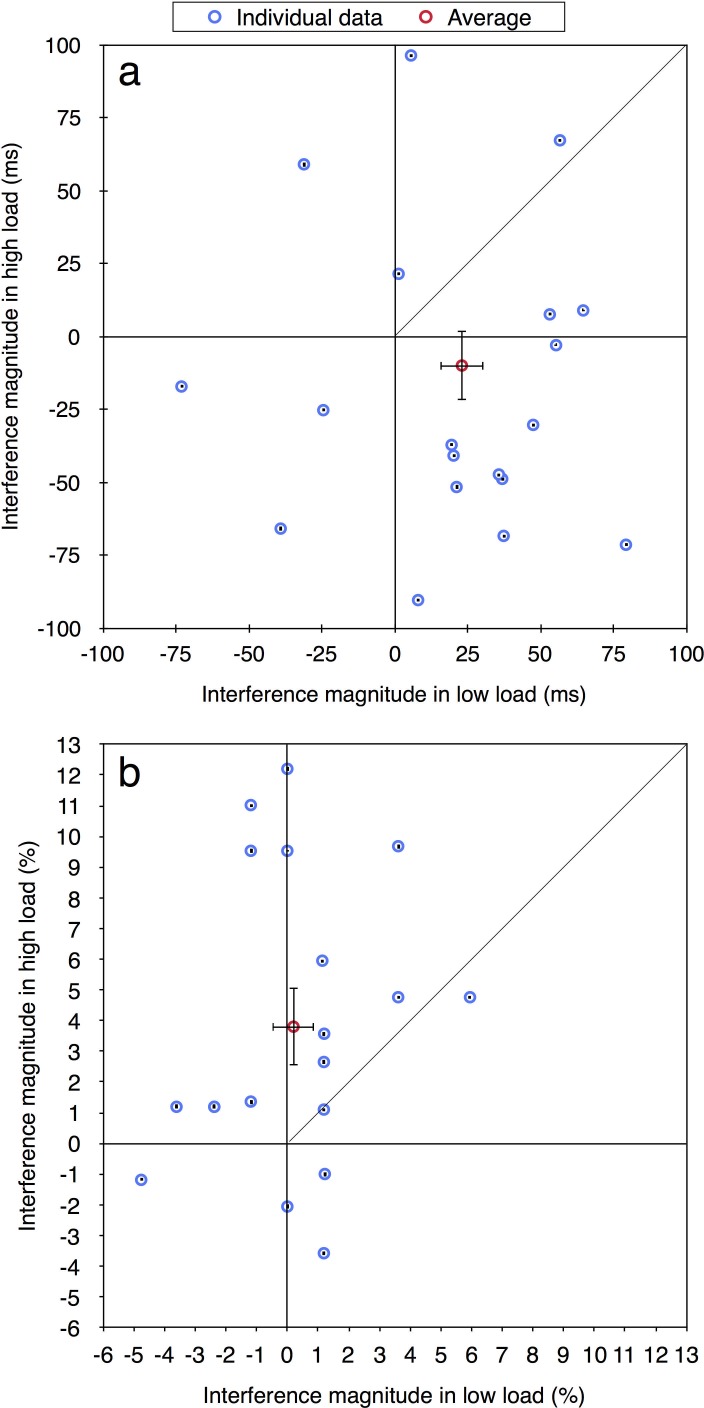
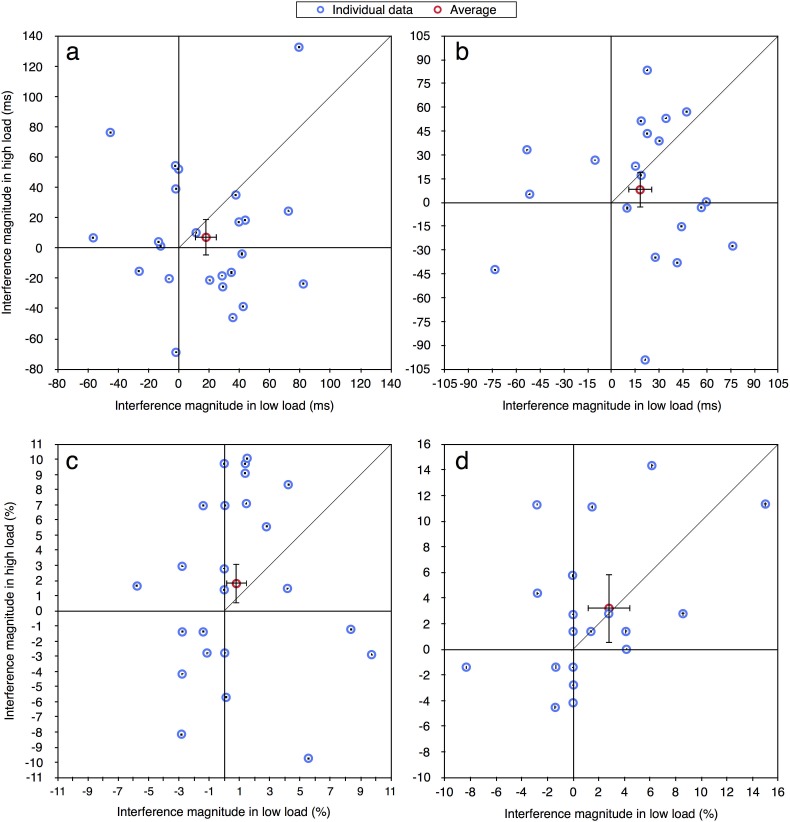
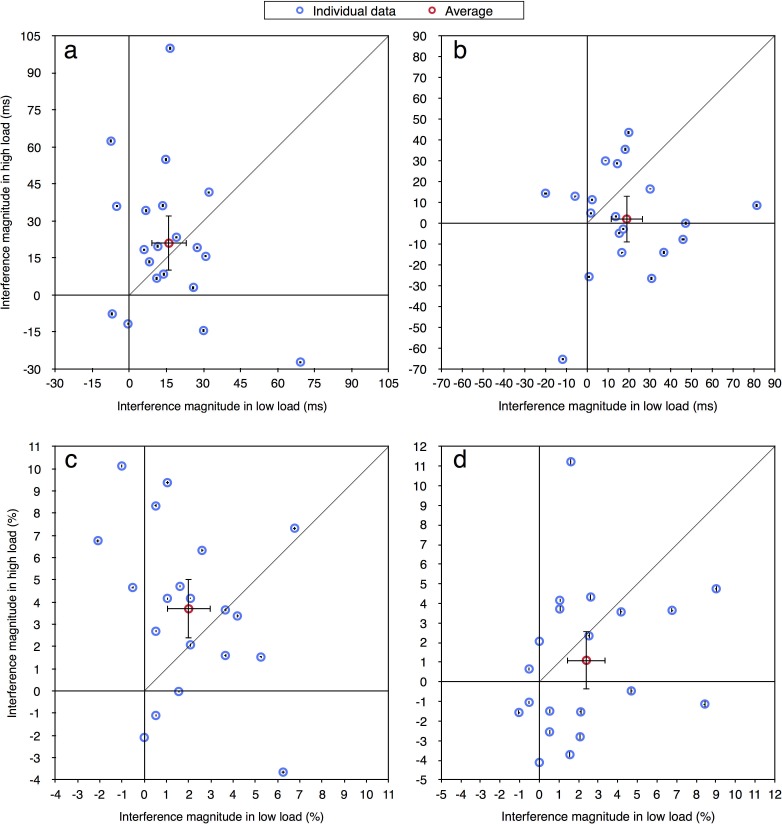
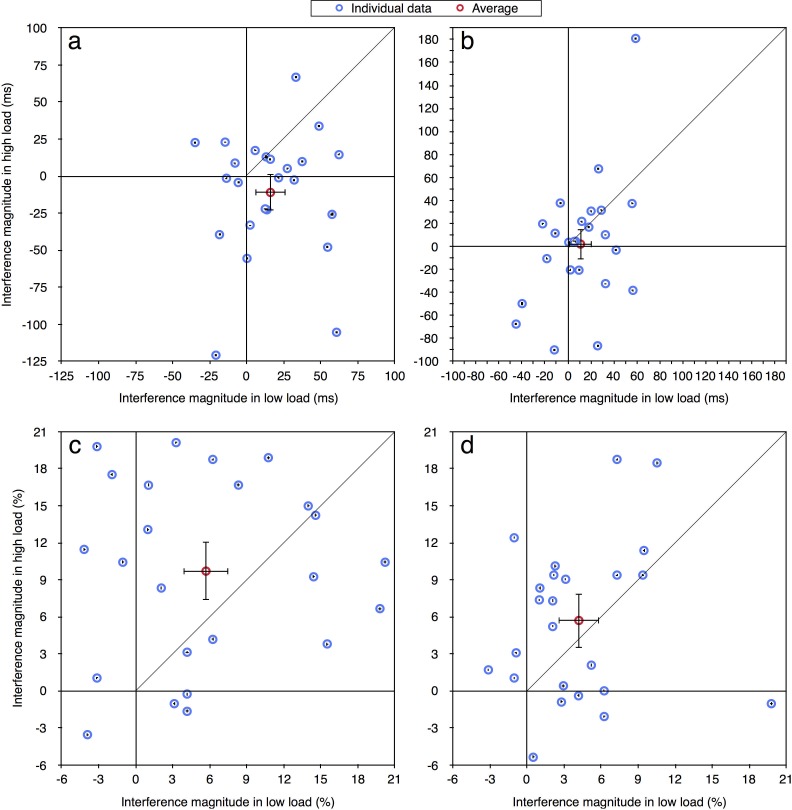
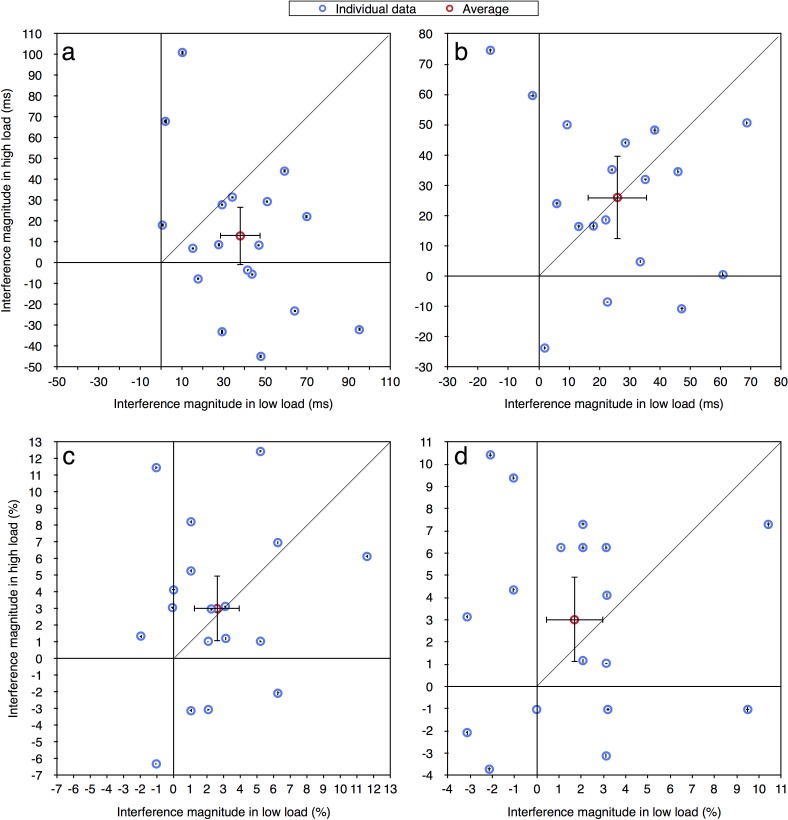
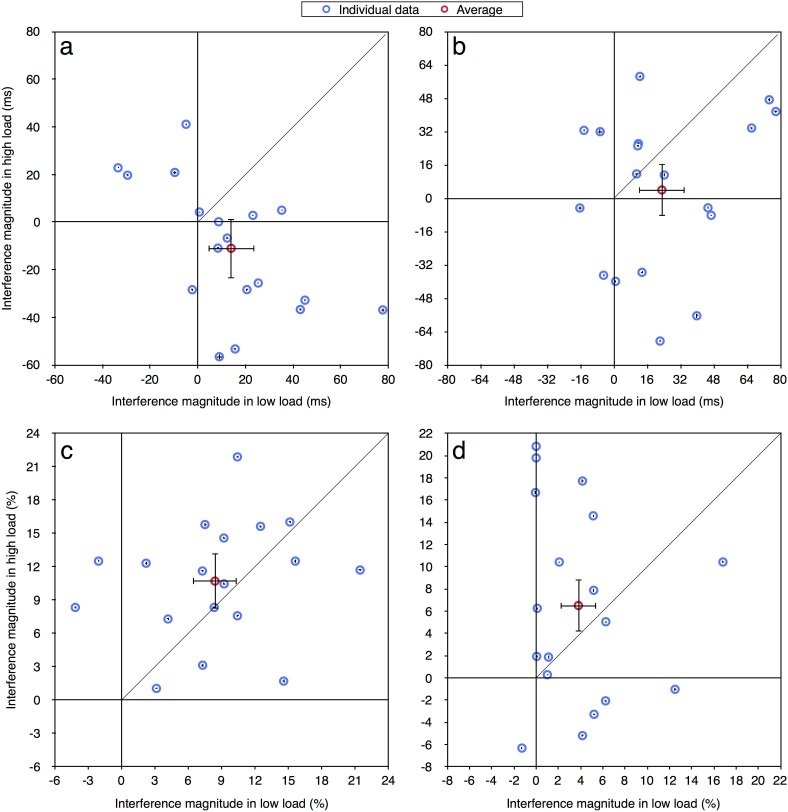
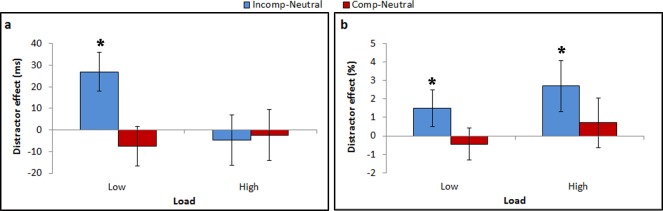
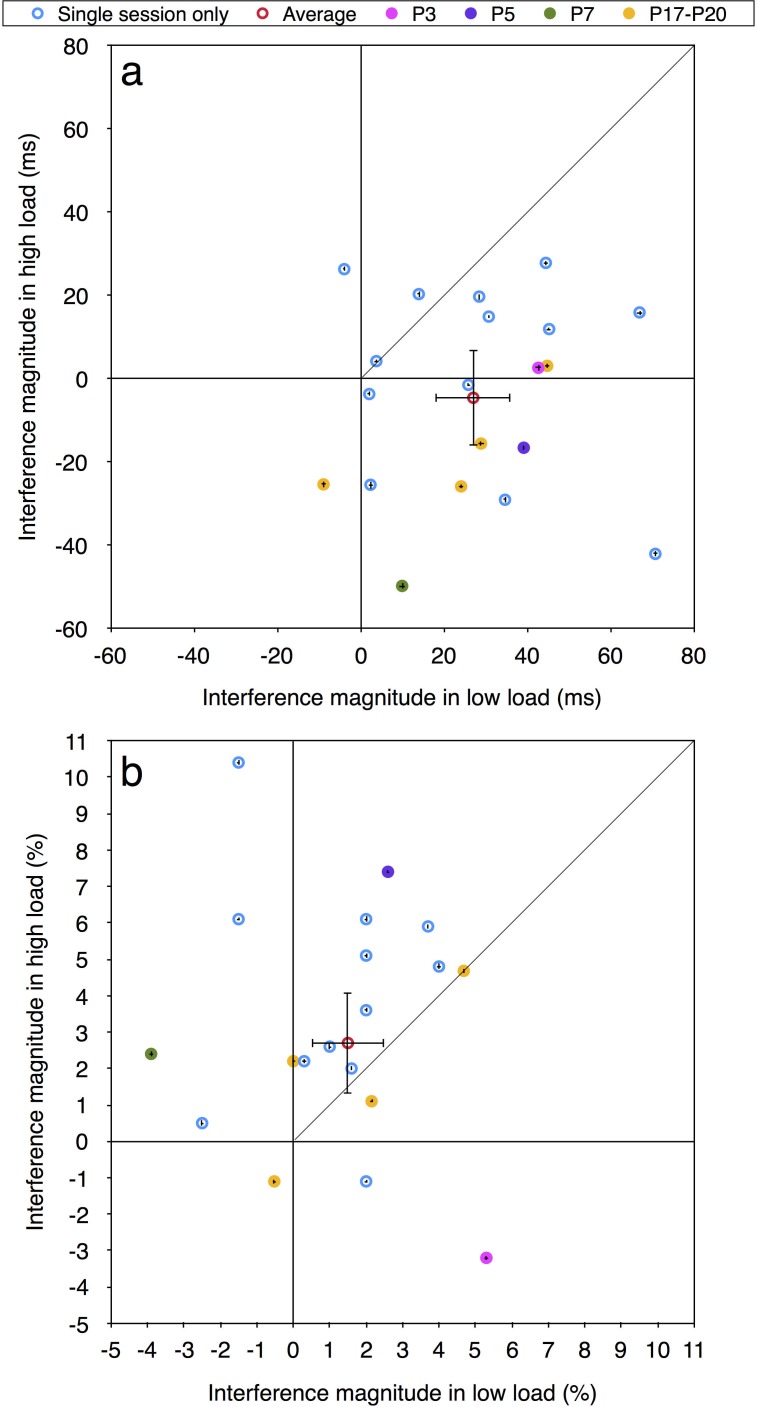
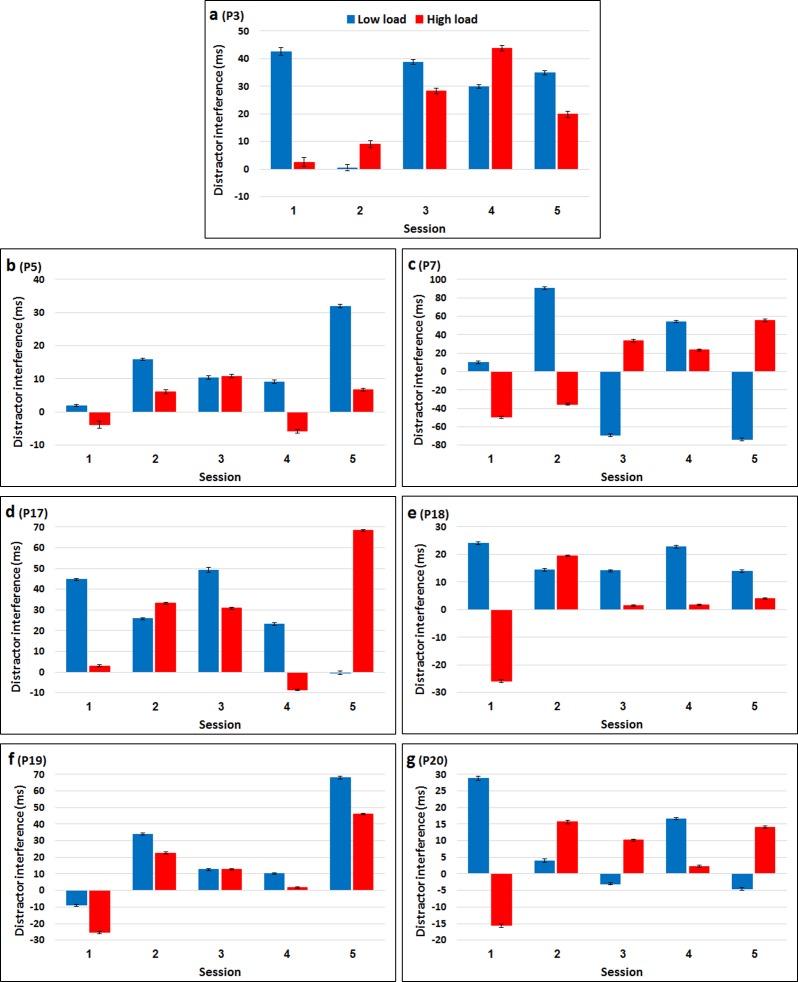
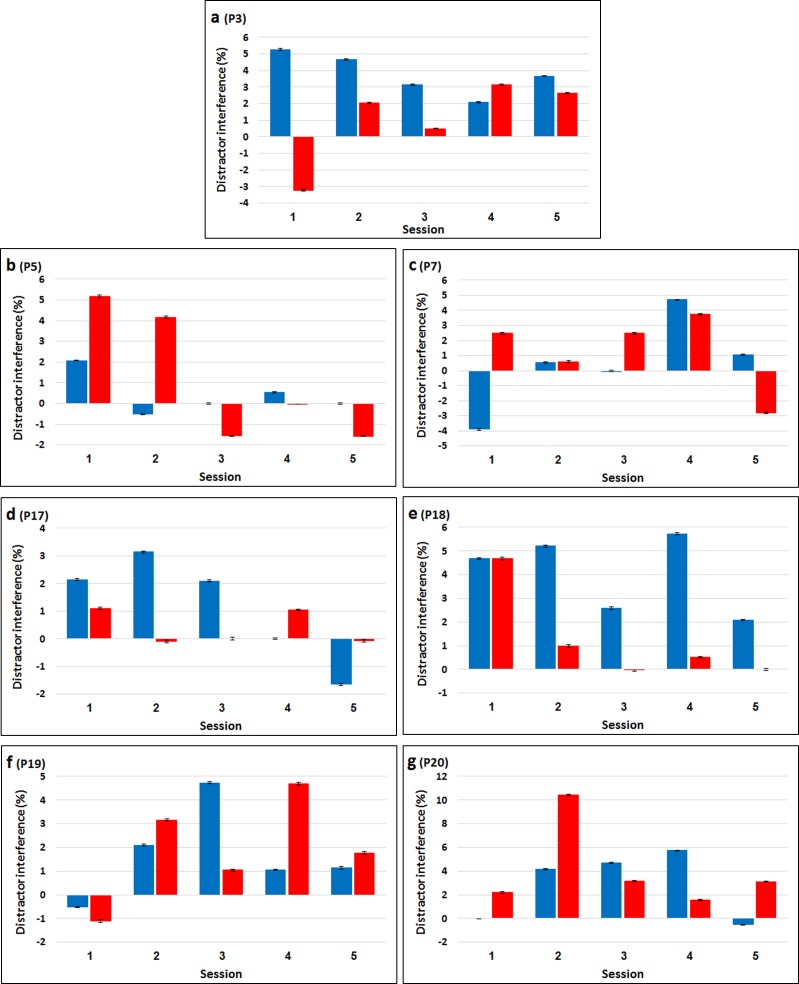
This study examined whether the recurrent difficulty to replicate results obtained with paradigms measuring distractor processing as a function of perceptual load is due to individual differences. We first reanalyzed, at the individual level, the data of eight previously reported experiments. These reanalyses revealed substantial inter-individual differences, with particularly low percentage of participants whose performance matched the load theory's predictions (i.e., larger distractor interference with low than high levels of load). Moreover, frequently the results were opposite to the theory's predictions-larger interference in the high than low load condition; and often a reversed compatibility effect emerged-better performance in the incompatible than neutral condition. Subsequently, seven observers participated in five identical experimental sessions. If the observed inter-individual differences are due to some stable trait or perceptual capacity, similar results should have emerged in all sessions of a given participant. However, all seven participants showed large between-sessions variations with similar patterns to those found between participants. These findings question the theoretical foundation implemented with these paradigms, as none of the theories suggested thus far can account for such inter- and intra-individual differences. Thus, these paradigms should be used with caution until further research will provide better understanding of what they actually measure.
Conflict of interest statement
Figures
Similar articles
-
The effects of acute stress and perceptual load on distractor interference.Q J Exp Psychol (Hove). 2012;65(4):617-23. doi: 10.1080/17470218.2011.648944. Q J Exp Psychol (Hove). 2012. PMID: 22463388 Clinical Trial.
-
Opposite effects of capacity load and resolution load on distractor processing.J Exp Psychol Hum Percept Perform. 2015 Feb;41(1):22-7. doi: 10.1037/xhp0000013. Epub 2014 Nov 3. J Exp Psychol Hum Percept Perform. 2015. PMID: 25365573 Free PMC article.
-
Visual salience can co-exist with dilution during visual selection.J Exp Psychol Hum Percept Perform. 2014 Feb;40(1):7-14. doi: 10.1037/a0033922. Epub 2013 Aug 12. J Exp Psychol Hum Percept Perform. 2014. PMID: 23937214
-
High perceptual load makes everybody equal: eliminating individual differences in distractibility with load.Psychol Sci. 2007 May;18(5):377-81. doi: 10.1111/j.1467-9280.2007.01908.x. Psychol Sci. 2007. PMID: 17576274
-
The factorial structure of individual differences in visual perception.Conscious Cogn. 2019 Aug;73:102762. doi: 10.1016/j.concog.2019.102762. Epub 2019 Jun 6. Conscious Cogn. 2019. PMID: 31176848 Review.
Cited by
-
Asymmetric Spatial Processing Under Cognitive Load.Front Psychol. 2018 Apr 23;9:583. doi: 10.3389/fpsyg.2018.00583. eCollection 2018. Front Psychol. 2018. PMID: 29740371 Free PMC article.
-
Trade-Off vs. Common Factor-Differentiating Resource-Based Explanations From Their Alternative.Front Psychol. 2022 Mar 11;13:774938. doi: 10.3389/fpsyg.2022.774938. eCollection 2022. Front Psychol. 2022. PMID: 35360631 Free PMC article. No abstract available.
-
Intra-individual variability in task performance after cognitive training is associated with long-term outcomes in children.Dev Sci. 2023 Jan;26(1):e13252. doi: 10.1111/desc.13252. Epub 2022 Mar 7. Dev Sci. 2023. PMID: 35184350 Free PMC article.
-
Visual Search in 3D: Effects of Monoscopic and Stereoscopic Cues to Depth on the Validity of Feature Integration Theory and Perceptual Load Theory.Front Psychol. 2021 Mar 17;12:596511. doi: 10.3389/fpsyg.2021.596511. eCollection 2021. Front Psychol. 2021. PMID: 33815197 Free PMC article.
-
Load effects in attention: Comparing tasks and age groups.Atten Percept Psychophys. 2020 Aug;82(6):3072-3084. doi: 10.3758/s13414-020-02055-6. Atten Percept Psychophys. 2020. PMID: 32394069
References
-
- Lavie N. Perceptual load as a necessary condition for selective attention. Journal of Experimental Psychology: Human perception and performance. 1995. June; 21(3):451 - PubMed
-
- Lavie N, Cox S. On the efficiency of attentional selection: Efficient visual search results in inefficient rejection of distraction. Psychological Science. 1997(8): 395–8.
-
- Marciano H, Yeshurun Y. The effects of perceptual load in central and peripheral regions of the visual field. Visual Cognition. 2011. March 1; 19(3):367–91.
-
- Chen Z. Attentional focus, processing load, and Stroop interference. Perception & Psychophysics. 2003. August 1; 65(6):888–900. - PubMed
MeSH terms
LinkOut - more resources
Full Text Sources
Other Literature Sources
