. 2017 Apr 13;12(4):e0174683.
doi: 10.1371/journal.pone.0174683. eCollection 2017.

Attrition and performance of community college transfers

Affiliations

Attrition and performance of community college transfers

Lovenoor Aulck et al. PLoS One. .

Abstract

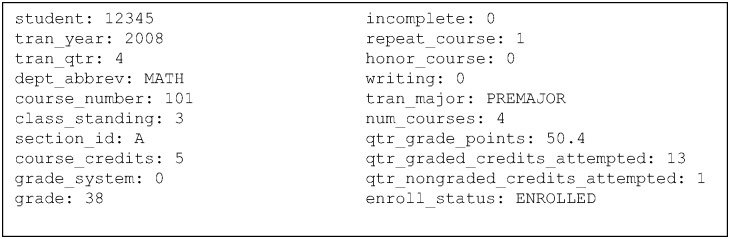
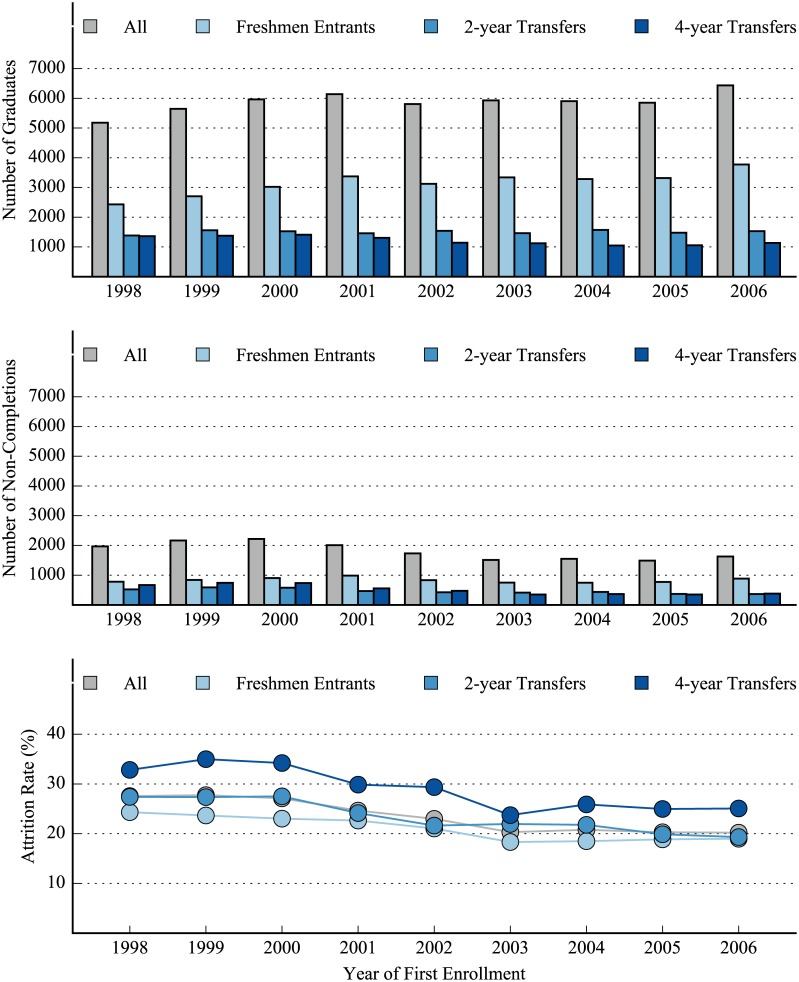
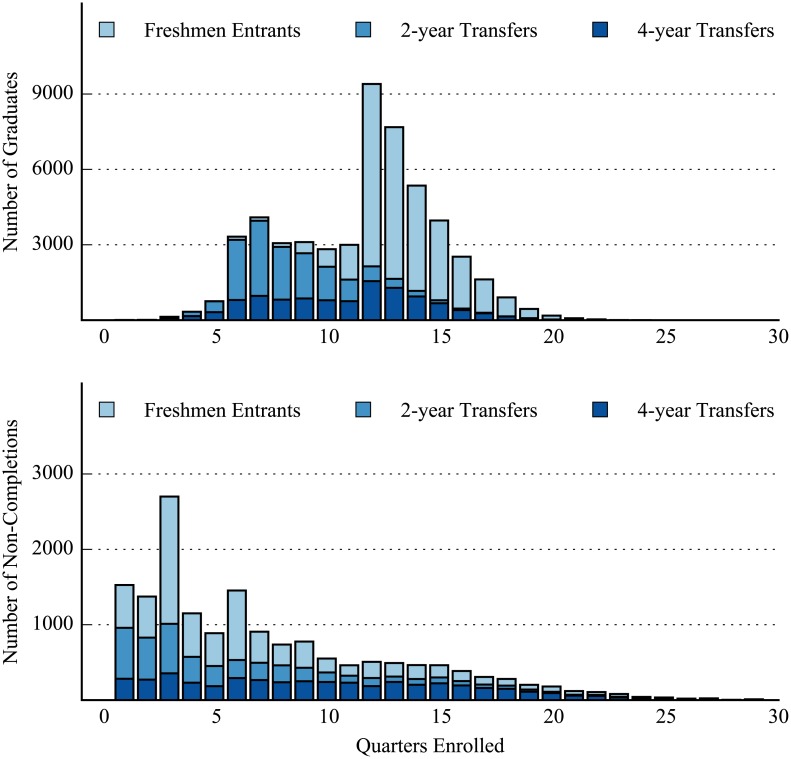
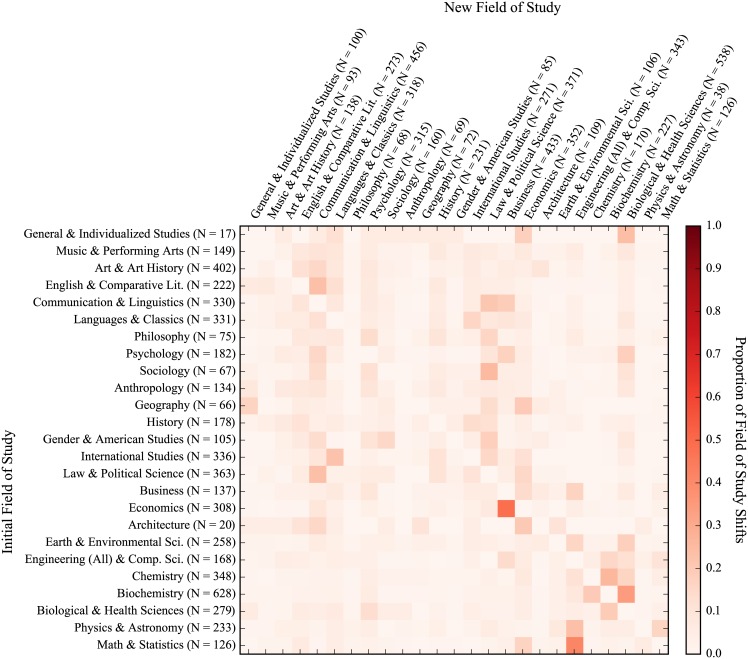
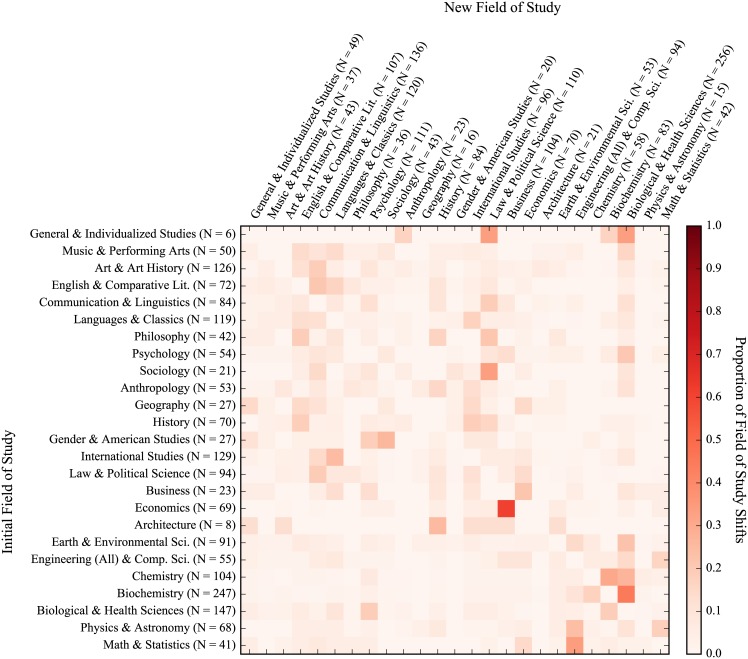
Community colleges are an important part of the US higher education landscape, yet the aptitude and preparedness of student transfers to baccalaureate institutions is often called into question. Examining transcript records and demographic information of nearly 70,000 students across over 15 years of registrar records at a public university, this study performed a descriptive analysis of the persistence, performance, and academic migration patterns of community college transfers, transfers from four-year institutions, and freshmen entrants. We found little difference between community college transfers and freshmen entrants in terms of post-transfer grades and persistence. Transfers from four-year institutions had higher grades but also had higher attrition rates than their peers. This study also found no strong evidence of transfer shock on students' post-transfer grades. When examining the tendencies of students to shift fields of study during their educational pursuits, the academic migration patterns of transfer students were more concentrated than those of freshmen entrants.


Conflict of interest statement

Competing Interests: The authors have declared that no competing interests exist.

Figures

Fig 1
Fig 1. Sample transcript record.
This provides a snapshot of the information available for each class taken by each student. Note that the enrollment status only indicates whether a student eventually withdrew from classes before the end of a single quarter—it was not used to determine graduation from the university.
Fig 2
Fig 2. Graduate counts (top), non-completion counts (middle), and attrition rates (bottom) for all students, freshmen entrants, 2-year transfers, and 4-year transfers across time.
An interactive visualization that allows for the data to be further segmented can be found at http://coursector.org/#/viz/attrition.
Fig 3
Fig 3. Number of quarters enrolled for graduates (top) and non-completions (bottom).
Histograms look at all quarters student received some transcript grade. Mean, median, and standard deviations for graduates—Freshmen Entrants: 13.48, 13, 2.21; 2-year Transfers: 8.31, 8, 2.33; 4-year Transfers: 10.87, 11, 3.50. Mean, median, and standard deviations for non-completions—Freshmen Entrants: 6.80, 5, 5.33; 2-year Transfers: 5.79, 4, 4.87; 4-year Transfers: 9.84, 9, 6.10.
Fig 4
Fig 4. Field of study migration heatmap for all students.
Values represent transfer of students from each row to each column. Proportions are normalized across rows. Counts for rows indicate outgoing students while counts for columns indicate incoming students. (NOTE: Figure rotated 90 degrees clockwise.)
Fig 5
Fig 5. Field of study migration heatmap for freshmen entrants.
Values represent transfer of students from each row to each column. Proportions are normalized across rows. Counts for rows indicate outgoing students while counts for columns indicate incoming students. (NOTE: Figure rotated 90 degrees clockwise.)
Fig 6
Fig 6. Field of study migration heatmap for 2-year transfers.
Values represent transfer of students from each row to each column. Proportions are normalized across rows. Counts for rows indicate outgoing students while counts for columns indicate incoming students. (NOTE: Figure rotated 90 degrees clockwise.)
Fig 7
Fig 7. Field of study migration heatmap for 4-year transfers.
Values represent transfer of students from each row to each column. Proportions are normalized across rows. Counts for rows indicate outgoing students while counts for columns indicate incoming students. (NOTE: Figure rotated 90 degrees clockwise.)

References

    1. Rouse CE. Democratization or Diversion? The Effect of Community Colleges on Educational Attainment. Journal of Business & Economic Statistics. 1995;13(2):217–224. 10.2307/1392376 - DOI
    1. Rouse CE. Do two-year colleges increase overall educational attainment? Evidence from the states. Journal of Policy Analysis and Management. 1998;17(4):595–620. 10.1002/(SICI)1520-6688(199823)17:4<595::AID-PAM1>3.0.CO;2-5 - DOI
    1. Leigh DE, Gill AM. Do community colleges really divert students from earning bachelor’s degrees? Economics of Education Review. 2003;22(1):23–30.
    1. Leigh DE, Gill AM. The effect of community colleges on changing students’ educational aspirations. Economics of Education Review. 2004;23(1):95–102.
    1. Gonzalez A, Hilmer MJ. The role of 2-year colleges in the improving situation of Hispanic postsecondary education. Economics of Education Review. 2006;25(3):249–257. 10.1016/j.econedurev.2004.12.002 - DOI