Procalcitonin as a Marker of Etiology in Adults Hospitalized With Community-Acquired Pneumonia
- PMID: 28407054
- PMCID: PMC5850442
- DOI: 10.1093/cid/cix317
Procalcitonin as a Marker of Etiology in Adults Hospitalized With Community-Acquired Pneumonia
Abstract
Background: Recent trials suggest procalcitonin-based guidelines can reduce antibiotic use for respiratory infections. However, the accuracy of procalcitonin to discriminate between viral and bacterial pneumonia requires further dissection.
Methods: We evaluated the association between serum procalcitonin concentration at hospital admission with pathogens detected in a multicenter prospective surveillance study of adults hospitalized with community-acquired pneumonia. Systematic pathogen testing included cultures, serology, urine antigen tests, and molecular detection. Accuracy of procalcitonin to discriminate between viral and bacterial pathogens was calculated.
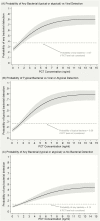
Results: Among 1735 patients, pathogens were identified in 645 (37%), including 169 (10%) with typical bacteria, 67 (4%) with atypical bacteria, and 409 (24%) with viruses only. Median procalcitonin concentration was lower with viral pathogens (0.09 ng/mL; interquartile range [IQR], <0.05-0.54 ng/mL) than atypical bacteria (0.20 ng/mL; IQR, <0.05-0.87 ng/mL; P = .05), and typical bacteria (2.5 ng/mL; IQR, 0.29-12.2 ng/mL; P < .01). Procalcitonin discriminated bacterial pathogens, including typical and atypical bacteria, from viral pathogens with an area under the receiver operating characteristic (ROC) curve of 0.73 (95% confidence interval [CI], .69-.77). A procalcitonin threshold of 0.1 ng/mL resulted in 80.9% (95% CI, 75.3%-85.7%) sensitivity and 51.6% (95% CI, 46.6%-56.5%) specificity for identification of any bacterial pathogen. Procalcitonin discriminated between typical bacteria and the combined group of viruses and atypical bacteria with an area under the ROC curve of 0.79 (95% CI, .75-.82).
Conclusions: No procalcitonin threshold perfectly discriminated between viral and bacterial pathogens, but higher procalcitonin strongly correlated with increased probability of bacterial pathogens, particularly typical bacteria.
Keywords: antibiotic stewardship; etiology; pneumonia; procalcitonin.
© The Author 2017. Published by Oxford University Press for the Infectious Diseases Society of America. All rights reserved. For permissions, e-mail: journals.permissions@oup.com.
Figures


Comment in
-
Procalcitonin: The Right Answer but to Which Question?Clin Infect Dis. 2017 Jul 15;65(2):191-193. doi: 10.1093/cid/cix323. Clin Infect Dis. 2017. PMID: 28407096 No abstract available.
-
Procalcitonin as a Marker of Etiology in Adults Hospitalized With Community-Acquired Pneumonia.Clin Infect Dis. 2018 May 2;66(10):1640-1641. doi: 10.1093/cid/cix1090. Clin Infect Dis. 2018. PMID: 29360954 No abstract available.
-
Procalcitonin as a Marker of Etiology in Community-Acquired Pneumonia.Clin Infect Dis. 2018 May 2;66(10):1639. doi: 10.1093/cid/cix1089. Clin Infect Dis. 2018. PMID: 29360957 No abstract available.
References
-
- Kung HC, Hoyert DL, Xu J, Murphy SL. Deaths: final data for 2005. Natl Vital Stat Rep 2008; 56:1–120. - PubMed
-
- Agency for Healthcare Research and Quality. Pneumonia is the most common reason for hospitalization Available at: http://www.ahrq.gov/research/sep08/0908RA40.htm Accessed 31 May 2011.
-
- Mandell LA, Wunderink RG, Anzueto A, et al. ; Infectious Diseases Society of America; American Thoracic Society Infectious Diseases Society of America/American Thoracic Society consensus guidelines on the management of community-acquired pneumonia in adults. Clin Infect Dis 2007; 44(suppl 2):S27–72. - PMC - PubMed
-
- Bartlett JG. Diagnostic tests for agents of community-acquired pneumonia. Clin Infect Dis 2011; 52(suppl 4):S296–304. - PubMed
Publication types
MeSH terms
Substances
Grants and funding
LinkOut - more resources
Full Text Sources
Other Literature Sources

