. 2017 Nov;36(11):2245-2256.
doi: 10.1002/jum.14209. Epub 2017 Apr 13.

Multiparametric Quantitative Ultrasound Imaging in Assessment of Chronic Kidney Disease

Affiliations

Multiparametric Quantitative Ultrasound Imaging in Assessment of Chronic Kidney Disease

Jing Gao et al. J Ultrasound Med. 2017 Nov.

Abstract

Objectives: To evaluate the value of multiparametric quantitative ultrasound imaging in assessing chronic kidney disease (CKD) using kidney biopsy pathologic findings as reference standards.

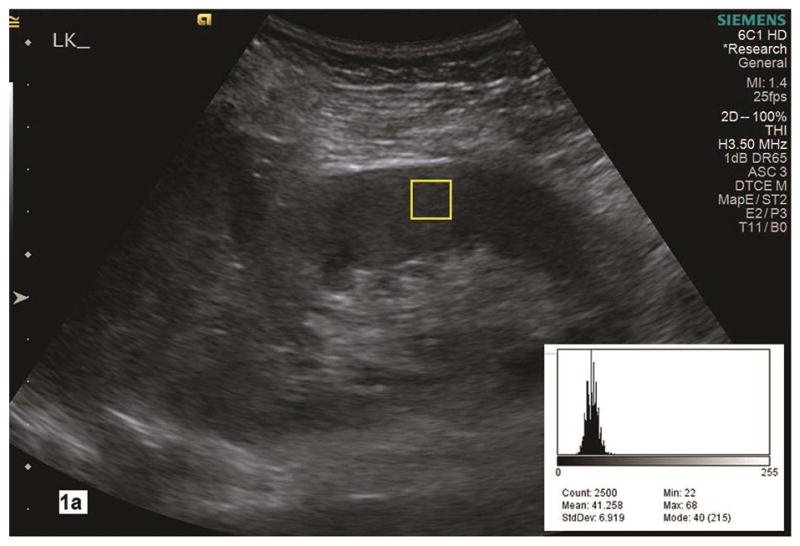
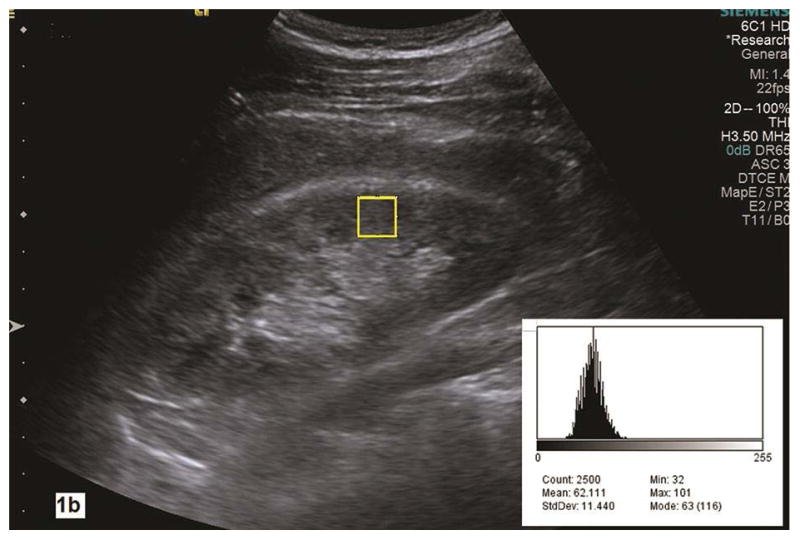
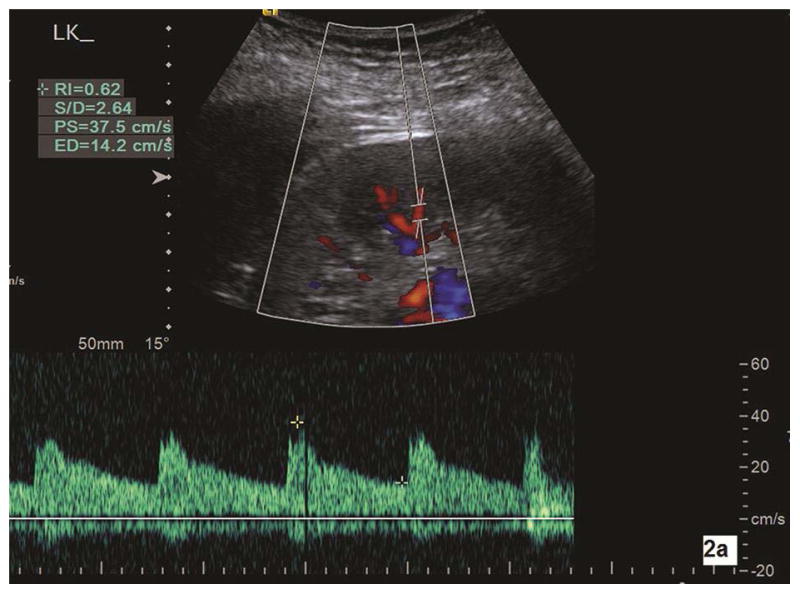
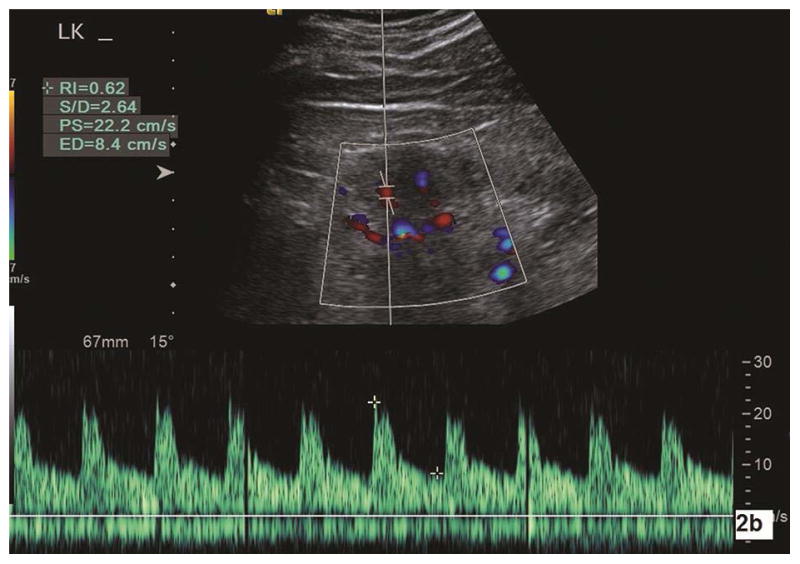
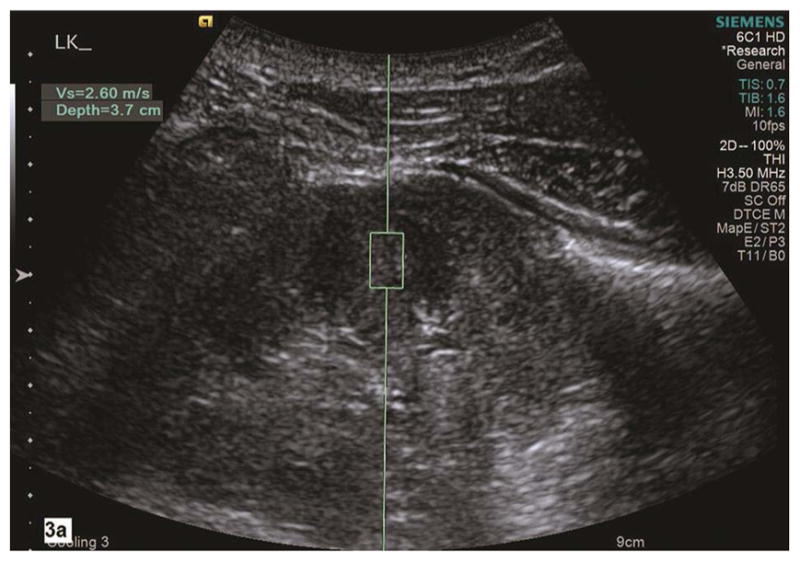
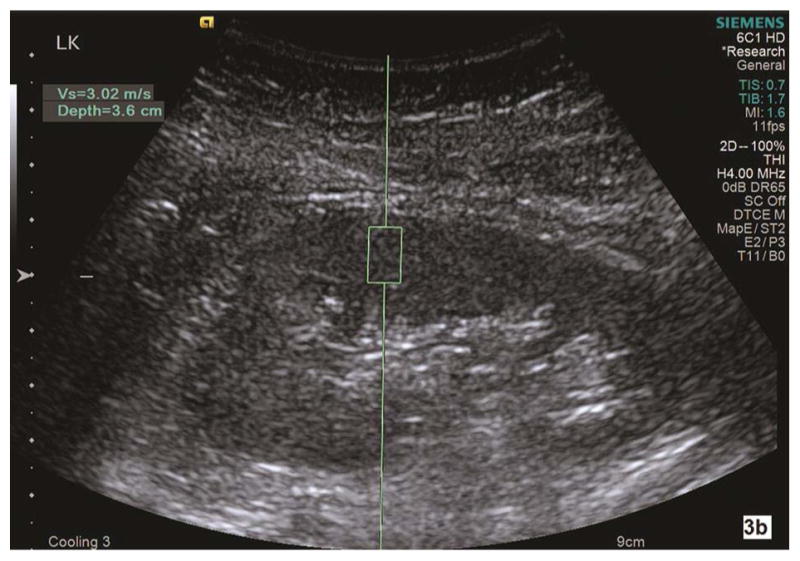
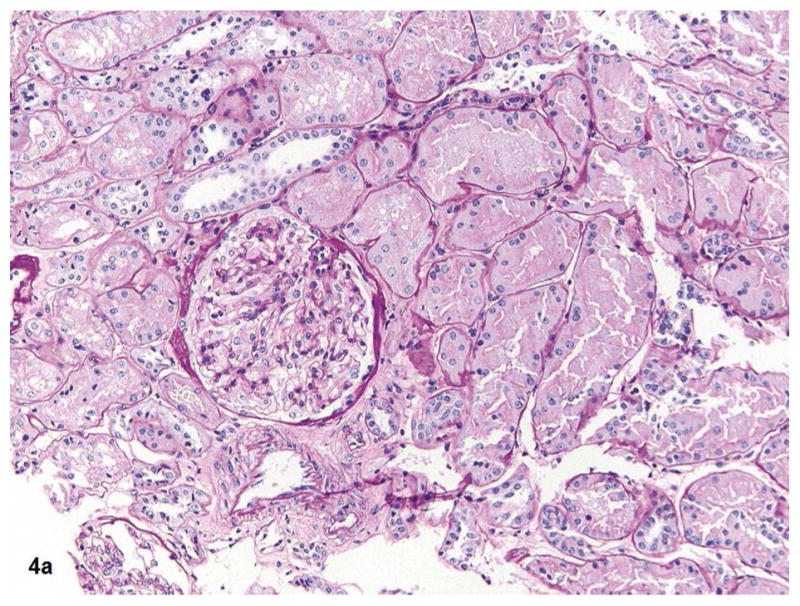
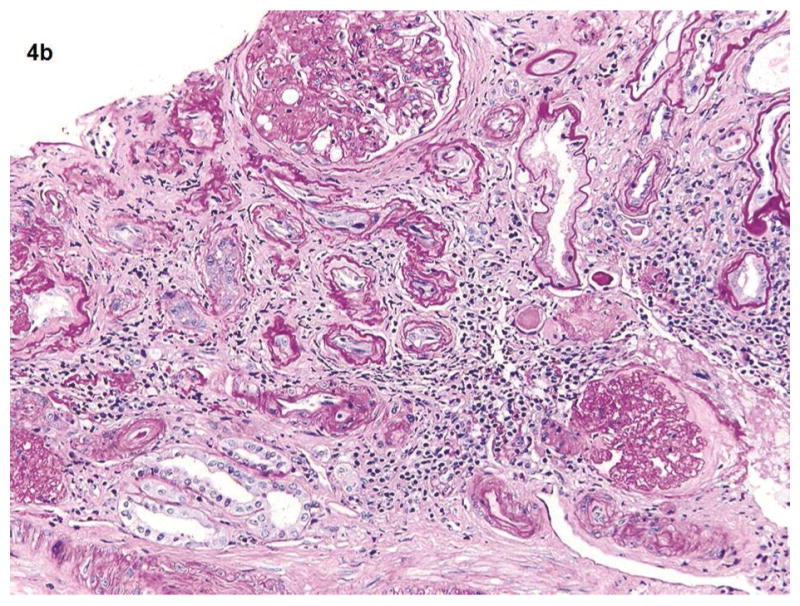
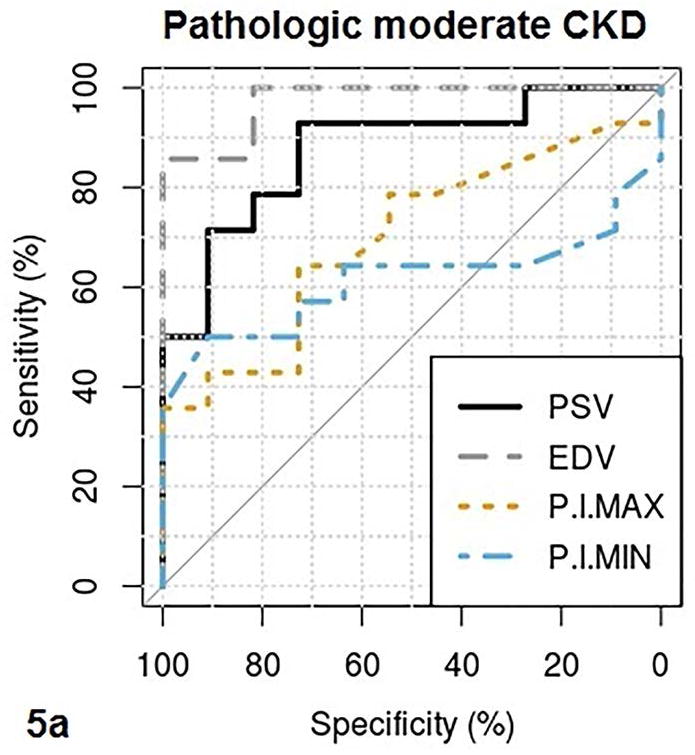
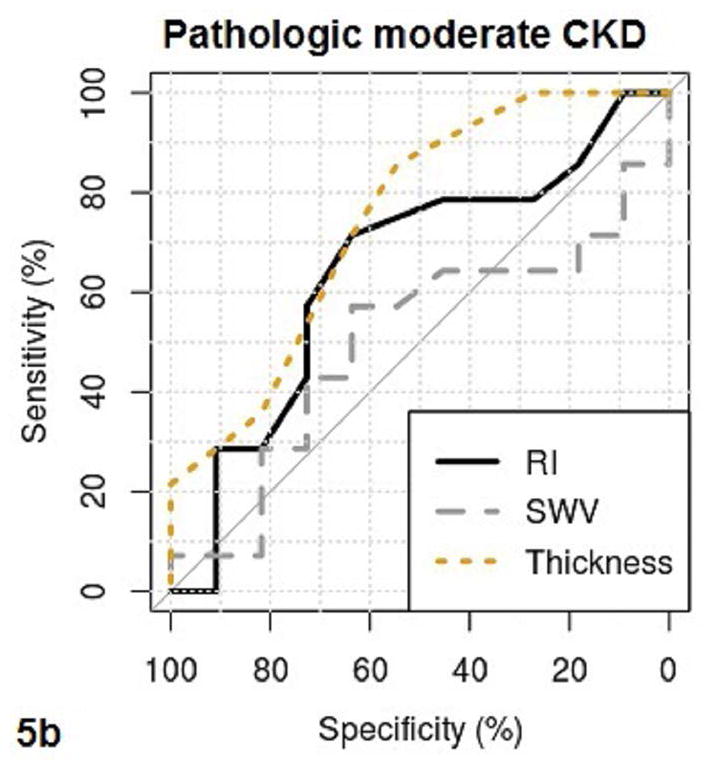
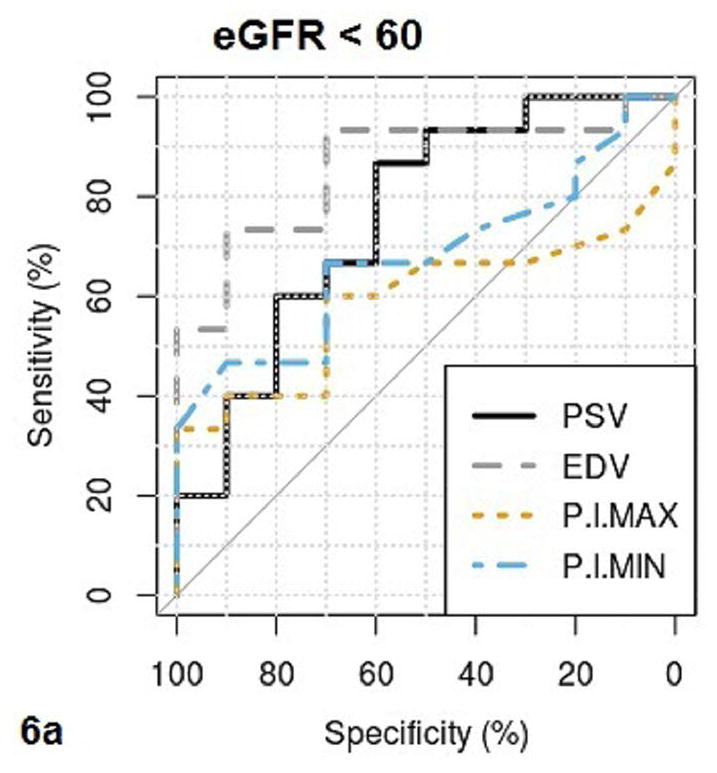
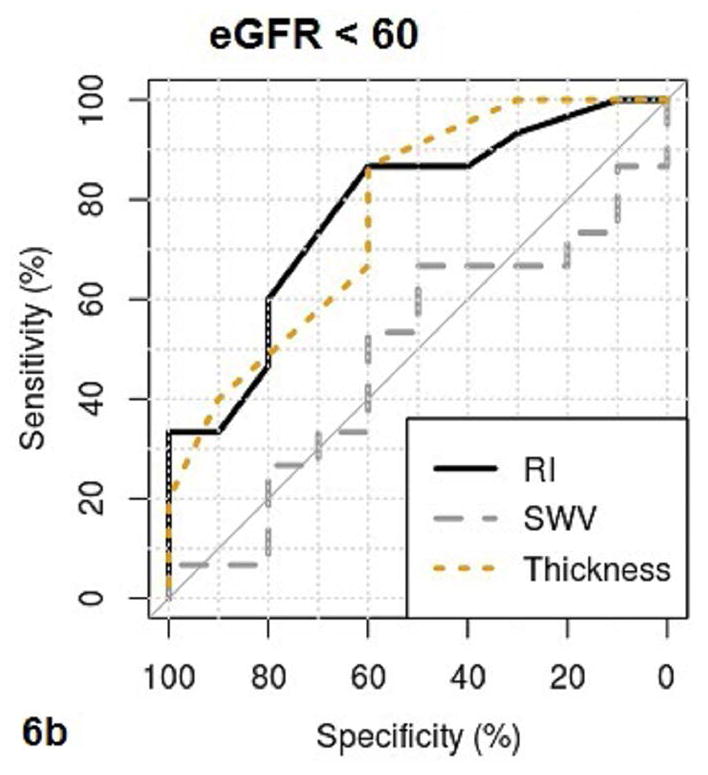
Methods: We prospectively measured multiparametric quantitative ultrasound markers with grayscale, spectral Doppler, and acoustic radiation force impulse imaging in 25 patients with CKD before kidney biopsy and 10 healthy volunteers. Based on all pathologic (glomerulosclerosis, interstitial fibrosis/tubular atrophy, arteriosclerosis, and edema) scores, the patients with CKD were classified into mild (no grade 3 and <2 of grade 2) and moderate to severe (at least 2 of grade 2 or 1 of grade 3) CKD groups. Multiparametric quantitative ultrasound parameters included kidney length, cortical thickness, pixel intensity, parenchymal shear wave velocity, intrarenal artery peak systolic velocity (PSV), end-diastolic velocity (EDV), and resistive index. We tested the difference in quantitative ultrasound parameters among mild CKD, moderate to severe CKD, and healthy controls using analysis of variance, analyzed correlations of quantitative ultrasound parameters with pathologic scores and the estimated glomerular filtration rate (GFR) using Pearson correlation coefficients, and examined the diagnostic performance of quantitative ultrasound parameters in determining moderate CKD and an estimated GFR of less than 60 mL/min/1.73 m2 using receiver operating characteristic curve analysis.

Results: There were significant differences in cortical thickness, pixel intensity, PSV, and EDV among the 3 groups (all P < .01). Among quantitative ultrasound parameters, the top areas under the receiver operating characteristic curves for PSV and EDV were 0.88 and 0.97, respectively, for determining pathologic moderate to severe CKD, and 0.76 and 0.86 for estimated GFR of less than 60 mL/min/1.73 m2 . Moderate to good correlations were found for PSV, EDV, and pixel intensity with pathologic scores and estimated GFR.

Conclusions: The PSV, EDV, and pixel intensity are valuable in determining moderate to severe CKD. The value of shear wave velocity in assessing CKD needs further investigation.

Keywords: Doppler ultrasound imaging; acoustic radiation force impulse; chronic kidney disease; quantitative ultrasound imaging; shear wave velocity.


Figures

Fig. 1a–b
Fig. 1a–b
Renal parenchyma pixel-intensity is measured in the grayscale image of a longitudinal section of the kidney with Image J analysis tool. A histogram (right lower corner) shows the value of pixel counts in the region of interest (yellow rectangle box, 2500 count) in the renal cortex. In the histogram, the Max is maximal pixel value and the Min is the minimal pixel value in the region of interest. Parenchymal maximal and minimal pixel-intensities measure 68 and 22 in 1a with pathologic mild CKD whereas they are 101 and 32 in 1b with pathologic moderate to severe CKD. LK, left kidney.
Fig. 1a–b
Fig. 1a–b
Renal parenchyma pixel-intensity is measured in the grayscale image of a longitudinal section of the kidney with Image J analysis tool. A histogram (right lower corner) shows the value of pixel counts in the region of interest (yellow rectangle box, 2500 count) in the renal cortex. In the histogram, the Max is maximal pixel value and the Min is the minimal pixel value in the region of interest. Parenchymal maximal and minimal pixel-intensities measure 68 and 22 in 1a with pathologic mild CKD whereas they are 101 and 32 in 1b with pathologic moderate to severe CKD. LK, left kidney.
Fig. 2a–b
Fig. 2a–b
Color Doppler sonography is used to measure the intrarenal artery Doppler parameters. 2a is a longitudinal section of the left kidney in a subject with pathologic mild CKD. With corrected Doppler angle (the direction of blood flow to the direction of the sound beam) of 15°, peak systolic velocity (PS), end diastolic velocity (ED), and resistive index (RI) measure 37.5 cm/s, 14.2 cm/s, and 0.62, respectively. Doppler parameters are measured in another subject with pathologic moderate CKD (2b). With corrected Doppler angle of 15°, interlobar artery peak systolic velocity (PS), end diastolic velocity (ED), and resistive index (RI) measure 22.2 cm/s, 8.4 cm/s, and 0.62, respectively. One can note that both peak systolic velocity and end diastolic velocity in moderate CKD are significantly lower than in mild CKD. LK, left kidney.
Fig. 2a–b
Fig. 2a–b
Color Doppler sonography is used to measure the intrarenal artery Doppler parameters. 2a is a longitudinal section of the left kidney in a subject with pathologic mild CKD. With corrected Doppler angle (the direction of blood flow to the direction of the sound beam) of 15°, peak systolic velocity (PS), end diastolic velocity (ED), and resistive index (RI) measure 37.5 cm/s, 14.2 cm/s, and 0.62, respectively. Doppler parameters are measured in another subject with pathologic moderate CKD (2b). With corrected Doppler angle of 15°, interlobar artery peak systolic velocity (PS), end diastolic velocity (ED), and resistive index (RI) measure 22.2 cm/s, 8.4 cm/s, and 0.62, respectively. One can note that both peak systolic velocity and end diastolic velocity in moderate CKD are significantly lower than in mild CKD. LK, left kidney.
Fig. 3a–b
Fig. 3a–b
Shear wave velocity (Vs) is measured on a sagittal section of the left kidney in a healthy subject (3a). Corticomedullary differentiation is appreciated in this grayscale image of the left kidney. Using Virtual Touch Tissue Quantification (VTQ) of ARFI imaging, the region of interest (ROI) is placed in the mid portion of the kidney cortex at the depth of 3.7 cm from the skin. Shear wave velocity is 2.60 m/s in this healthy subject. The ROI is placed in mid portion of renal parenchyma between kidney capsule and collecting system. The corticomedullary differentiation appears not optimal in grayscale ultrasound image (3b). SWV measures 3.02 m/s in the left kidney in this subject with pathologic moderate CKD and eGFR 45. LK, left kidney.
Fig. 3a–b
Fig. 3a–b
Shear wave velocity (Vs) is measured on a sagittal section of the left kidney in a healthy subject (3a). Corticomedullary differentiation is appreciated in this grayscale image of the left kidney. Using Virtual Touch Tissue Quantification (VTQ) of ARFI imaging, the region of interest (ROI) is placed in the mid portion of the kidney cortex at the depth of 3.7 cm from the skin. Shear wave velocity is 2.60 m/s in this healthy subject. The ROI is placed in mid portion of renal parenchyma between kidney capsule and collecting system. The corticomedullary differentiation appears not optimal in grayscale ultrasound image (3b). SWV measures 3.02 m/s in the left kidney in this subject with pathologic moderate CKD and eGFR 45. LK, left kidney.
Fig. 4a–b
Fig. 4a–b
Fig 4a shows the kidney biopsy pathology from a 25 years old female with proteinuria for 3 months and normal kidney function (eGFR >60). The renal cortex shows glomerulus, tubules, and vessels within no significant global glomerulosclerosis, interstitial fibrosis, or vascular sclerosis (PAS 20x). Total kidney pathology score for this subject is 0. Fig 4b shows the kidney biopsy pathology from a 62-year-old male with long term type 2 diabetes mellitus and hypertension. His eGFR is 34. Renal cortex with severe (grade 3) interstitial fibrosis, tubular atrophy, chronic interstitial inflammation, global glomerulosclerosis and vascular sclerosis (PAS 20x). His kidney biopsy pathology result indicates a pathologic severe CKD.
Fig. 4a–b
Fig. 4a–b
Fig 4a shows the kidney biopsy pathology from a 25 years old female with proteinuria for 3 months and normal kidney function (eGFR >60). The renal cortex shows glomerulus, tubules, and vessels within no significant global glomerulosclerosis, interstitial fibrosis, or vascular sclerosis (PAS 20x). Total kidney pathology score for this subject is 0. Fig 4b shows the kidney biopsy pathology from a 62-year-old male with long term type 2 diabetes mellitus and hypertension. His eGFR is 34. Renal cortex with severe (grade 3) interstitial fibrosis, tubular atrophy, chronic interstitial inflammation, global glomerulosclerosis and vascular sclerosis (PAS 20x). His kidney biopsy pathology result indicates a pathologic severe CKD.
Fig. 5a–b
Fig. 5a–b
These figures show the area under the receiver operating characteristics (AUROC) of QUI parameters of PSV, EDV, maximal pixel-intensity (P.I.Max), minimal pixel-intensity (P.I.Min) (5a), and RI, SWV, cortical thickness (Thickness) (5b) for determining pathologic moderate to severe CKD. The cutoff value, sensitivity and specificity of each QUI parameter in determining pathologic moderate to severe CKD are listed in Table 5.
Fig. 5a–b
Fig. 5a–b
These figures show the area under the receiver operating characteristics (AUROC) of QUI parameters of PSV, EDV, maximal pixel-intensity (P.I.Max), minimal pixel-intensity (P.I.Min) (5a), and RI, SWV, cortical thickness (Thickness) (5b) for determining pathologic moderate to severe CKD. The cutoff value, sensitivity and specificity of each QUI parameter in determining pathologic moderate to severe CKD are listed in Table 5.
Fig. 6a–b
Fig. 6a–b
These figures show the area under the receiver operating characteristics (AUROC) of QUI parameters of PSV, EDV, maximal pixel-intensity (P.I.Max), minimal pixel-intensity (P.I.Min) (6a), and RI, SWV, cortical thickness (Thickness) (6b) for determining CKD with eGFR <60. The cutoff value, sensitivity and specificity of each QUI parameter in determining eGFR <60 are listed in Table 5.
Fig. 6a–b
Fig. 6a–b
These figures show the area under the receiver operating characteristics (AUROC) of QUI parameters of PSV, EDV, maximal pixel-intensity (P.I.Max), minimal pixel-intensity (P.I.Min) (6a), and RI, SWV, cortical thickness (Thickness) (6b) for determining CKD with eGFR <60. The cutoff value, sensitivity and specificity of each QUI parameter in determining eGFR <60 are listed in Table 5.

References

    1. Levey AS, Stevens LA, Schmid CH, et al. CKD-EPI (Chronic Kidney Disease Epidemiology Collaboration). A new equation to estimate glomerular filtration rate. Ann Intern Med. 2009;150:604–612. - PMC - PubMed
    1. El Nahas M. The global challenge of chronic kidney disease. Kidney Int. 2005;68:2918–2929. - PubMed
    1. Liu Y. Cellular and molecular mechanisms of renal fibrosis. Nat Rev Nephrol. 2011;7:684–696. - PMC - PubMed
    1. Boffa JJ, Lu Y, Placier S, Stefanski A, Dussaule JC, Chatziantoniou C. Regression of renal vascular and glomerular fibrosis: role of angiotensin II receptor antagonism and matrix metalloproteinases. J Am Soc Nephrol. 2003;14:1132–1144. - PubMed
    1. Jha V, Garcia-Garcia G, Iseki K, et al. Chronic kidney disease: global dimension and perspectives. Lancet. 2013;382:260–272. - PubMed

Publication types

LinkOut - more resources