

The association between self-rated health and different anthropometric and body composition measures in the Chinese population
- PMID: 28407795
- PMCID: PMC5390392
- DOI: 10.1186/s12889-017-4249-0
The association between self-rated health and different anthropometric and body composition measures in the Chinese population
Abstract
Background: To analyze the strength of association between self-rated health and six anthropometric and body composition measures to explore the best indicator.
Methods: Analyses were based on the cross-sectional data from the China Kadoorie Biobank Study and approximately 300,000 adults were analyzed. Logistics regression was used to analyze the association between self-rated health (good or poor) and anthropometric and body composition measures (height, weight, body mass index (BMI), waist circumference (WC), hip circumference (HC) and body fat percentage, waist-to-hip ratio and waist-to-height ratio). Stratified analyses were undertaken to understand the effect modification of socioeconomic status on the association.
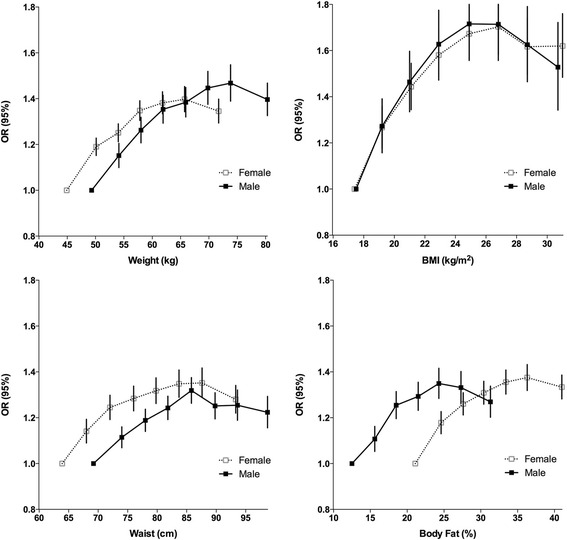
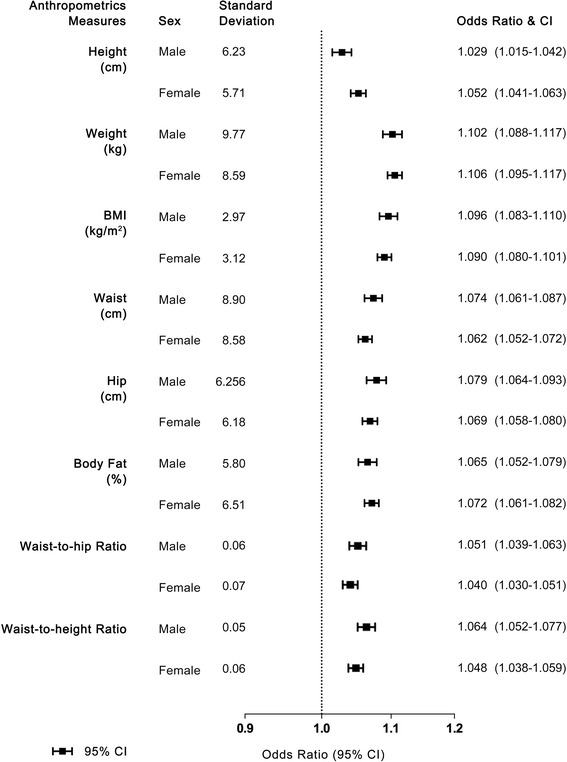
Result: Odds ratio of self-rated better health had an inverted U-shape association with weight, BMI, WC and body fat, with weight levels increasing until around 73.8 and 65.7 kg for male and female, BMI around 26.8 kg/m2, WC around 85.8 and 87.6 cm, body fat around 24.3 and 36.3%, and then declining thereafter. Height and HC also indicated a slightly inverted U-shape association. The strongest association was observed after adjustment was weight, with one standard deviation greater weight associated with 10.2% and 10.6% increased odds in male and female.
Conclusions: Being underweight and overweight are both risk factors for poor self-rated health in males and females, and weight is the best indicator of self-rated health compared with other measures.
Keywords: BMI; Chinese; Obesity; Self-rated Health; Waist Circumference.
Figures
Similar articles
-
[Analysis of association between appendicular skeletal muscle mass index and main anthropometric parameters among overweight and obese adults in China].Zhonghua Yu Fang Yi Xue Za Zhi. 2017 Aug 6;51(8):746-750. doi: 10.3760/cma.j.issn.0253-9624.2017.08.016. Zhonghua Yu Fang Yi Xue Za Zhi. 2017. PMID: 28763926 Chinese.
-
Obesity diagnosis and mortality risk based on a body shape index (ABSI) and other indices and anthropometric parameters in university students.Rocz Panstw Zakl Hig. 2019;70(3):267-275. doi: 10.32394/rpzh.2019.0077. Rocz Panstw Zakl Hig. 2019. PMID: 31515986
-
Anthropometric characteristics and body composition in Mexican older adults: age and sex differences.Br J Nutr. 2016 Feb 14;115(3):490-9. doi: 10.1017/S0007114515004626. Epub 2015 Nov 24. Br J Nutr. 2016. PMID: 26597049
-
Untangling Waist Circumference and Hip Circumference from Body Mass Index with a Body Shape Index, Hip Index, and Anthropometric Risk Indicator.Metab Syndr Relat Disord. 2018 May;16(4):160-165. doi: 10.1089/met.2017.0166. Epub 2018 Mar 13. Metab Syndr Relat Disord. 2018. PMID: 29649376 Review.
-
The use and interpretation of anthropometric measures in cancer epidemiology: A perspective from the world cancer research fund international continuous update project.Int J Cancer. 2016 Dec 1;139(11):2391-7. doi: 10.1002/ijc.30248. Epub 2016 Jul 13. Int J Cancer. 2016. PMID: 27352197 Review.
Cited by
-
Non-linear relationship between body mass index and self-rated health in older Korean adults: body image and sex considerations.Epidemiol Health. 2023;45:e2023061. doi: 10.4178/epih.e2023061. Epub 2023 Jun 20. Epidemiol Health. 2023. PMID: 37402412 Free PMC article.
-
The Relationship between Lifestyle Factors and Body Compositionin Young Adults.Int J Environ Res Public Health. 2017 Aug 8;14(8):893. doi: 10.3390/ijerph14080893. Int J Environ Res Public Health. 2017. PMID: 28786940 Free PMC article.
-
Factors associated with adherence to recommendations for medical visits following annual health checkups among Japanese employees: A prospective cohort study.Prev Med Rep. 2023 Dec 21;37:102565. doi: 10.1016/j.pmedr.2023.102565. eCollection 2024 Jan. Prev Med Rep. 2023. PMID: 38226327 Free PMC article.
-
Diverging ideas of health? Comparing the basis of health ratings across gender, age, and country.Soc Sci Med. 2020 Dec;267:112913. doi: 10.1016/j.socscimed.2020.112913. Epub 2020 Mar 17. Soc Sci Med. 2020. PMID: 32197880 Free PMC article.
-
Early-life famine exposure and rheumatoid arthritis in Chinese adult populations: a retrospective cohort study.BMJ Open. 2021 Jul 5;11(7):e043416. doi: 10.1136/bmjopen-2020-043416. BMJ Open. 2021. PMID: 34226211 Free PMC article.
References
MeSH terms
LinkOut - more resources
Full Text Sources
Other Literature Sources
