

Binocular Measures of Visual Acuity and Visual Field versus Binocular Approximations
- PMID: 28408039
- PMCID: PMC5483206
- DOI: 10.1016/j.ophtha.2017.02.013
Binocular Measures of Visual Acuity and Visual Field versus Binocular Approximations
Abstract
Purpose: To assess the relationship of binocular visual function tests with binocular approximations using data from the Collaborative Initial Glaucoma Treatment Study (CIGTS).
Design: Case series based on existing data from a clinical trial.
Participants: Six hundred seven patients with newly diagnosed open-angle glaucoma from the CIGTS.
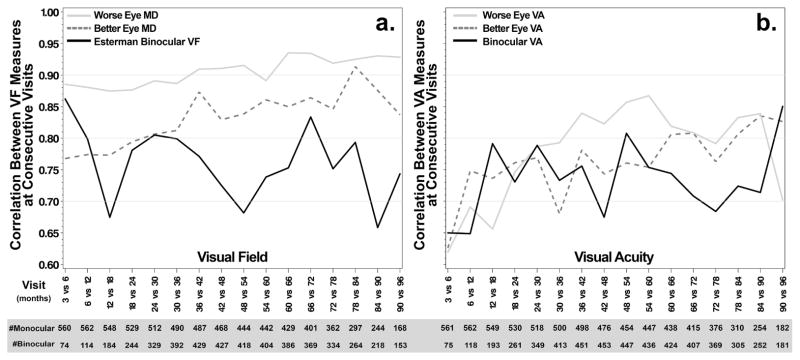
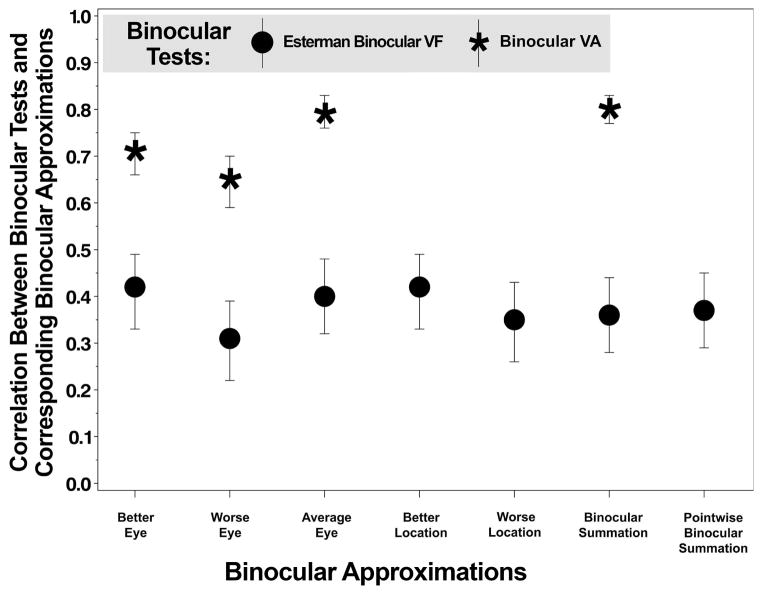
Methods: Monocular visual field (VF) and visual acuity (VA) tests were performed at baseline and every 6 months thereafter. Binocular tests of visual function (Esterman VF score, binocular VA) were added to the CIGTS protocol 3 years into the study. The binocular approximations of binocular visual function were better or worse eye, average eye, better or worse location, and binocular summation or pointwise binocular summation. Associations between binocular tests and binocular approximations to represent binocular visual function were assessed with Pearson's correlations (r), as was the relationship between vision-related quality of life (VR QOL; Visual Activities Questionnaire [VAQ] and the 25-item National Eye Institute Visual Function Questionnaire [NEI VFQ-25]) and binocular tests or binocular approximations of visual function.
Main outcome measures: Binocular visual function (VF and VA) and VR QOL.
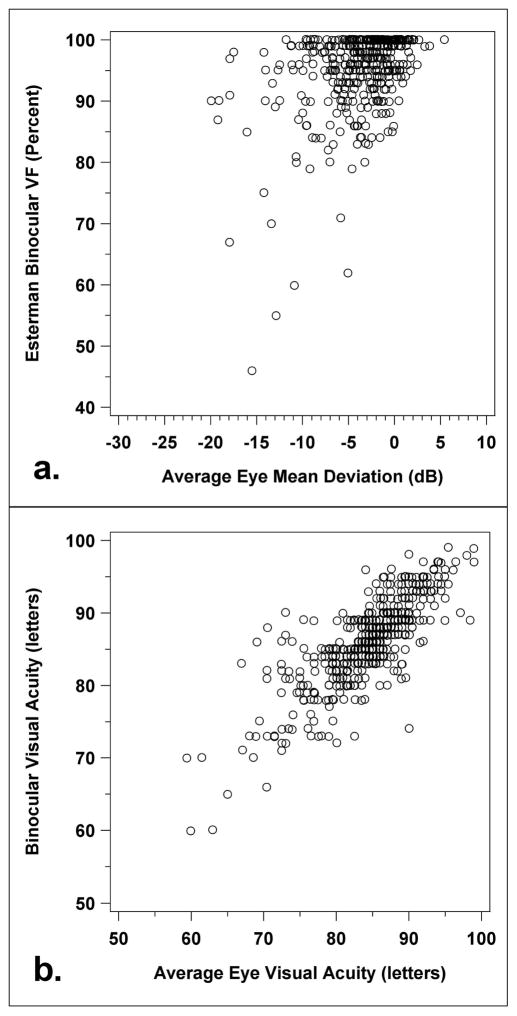
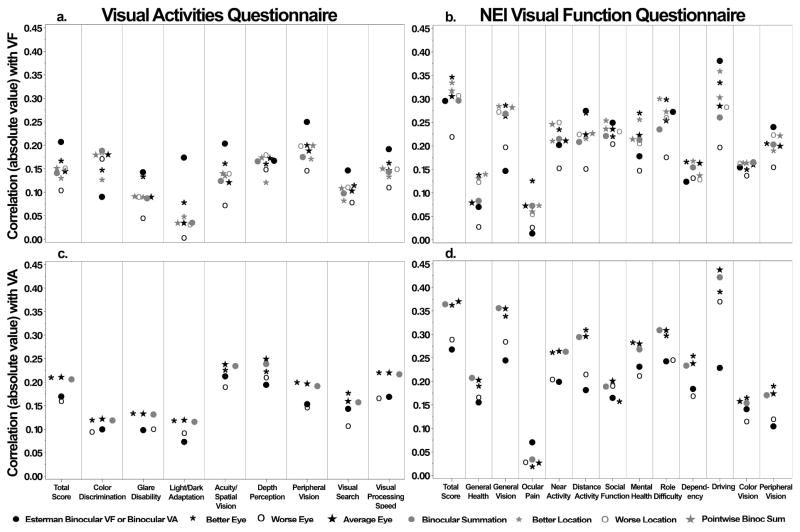
Results: Five hundred seventy-five patients underwent at least 1 binocular visual function test. The Esterman score was correlated significantly with all binocular approximations of VF, with r values ranging from 0.31 (worse-eye mean deviation [MD]) to 0.42 (better-eye MD; P < 0.0001 for all). Binocular VA showed stronger correlations with binocular approximations, with r values ranging from 0.65 (worse-eye VA) to 0.80 (binocular summation; P < 0.0001 for all). Correlations between the VAQ and Esterman score were stronger in 7 of 9 subscales (r = -0.14 to -0.25; P < 0.05 for all) than correlations with all 7 binocular approximations. In contrast, correlations between the VAQ and binocular VA (r = -0.07 to -0.21) were weaker in all subscales than those with better-eye, average-eye, and binocular summation of VA (r = -0.12 to -0.25), but not different from worse-eye values. These trends also were found in relevant subscales of the NEI VFQ-25.
Conclusions: We found limited benefit in binocular testing of VA in the clinical setting as a means of approximating a patient's reported visual functioning. In contrast, we found some benefit in performing binocular VF testing, because the results correlated more closely with reported functioning than binocular approximations.
Trial registration: ClinicalTrials.gov NCT00000149.
Copyright © 2017 American Academy of Ophthalmology. Published by Elsevier Inc. All rights reserved.
Conflict of interest statement
No conflicting relationship exists for any author
Figures
References
-
- Sloane ME, Ball K, Owsley C, et al. The Visual Activities Questionnaire: developing an instrument for assessing problems in everyday visual tasks. Tech Dig Noninvasive Assess Vis Syst. 1992;1:26–9.
-
- Mangione CM, Lee PP, Gutierez P, et al. Development of the 25-item National Eye Institute Visual Function Questionnaire (NEI-VFQ) Arch Ophthalmol. 2001;119:1050–8. - PubMed
-
- Mills RP, Janz NK, Wren PA, et al. Correlation of visual field with quality-of-life measures at diagnosis in the Collaborative Initial Glaucoma Treatment Study (CIGTS) J Glaucoma. 2001;10:192–8. - PubMed
-
- Musch DC, Lichter PR, Guire KE, et al. The Collaborative Initial Glaucoma Treatment Study (CIGTS): study design, methods, and baseline characteristics of enrolled patients. Ophthalmology. 1999;106:653–62. - PubMed
-
- Ferris FL, Kassoff A, Bresnick GH, Bailey I. New visual acuity charts for clinical research. Am J Ophthalmol. 1982;94:91–6. - PubMed
Publication types
MeSH terms
Substances
Associated data
Grants and funding
LinkOut - more resources
Full Text Sources
Other Literature Sources
Medical
