

Estimates and 25-year trends of the global burden of disease attributable to ambient air pollution: an analysis of data from the Global Burden of Diseases Study 2015
- PMID: 28408086
- PMCID: PMC5439030
- DOI: 10.1016/S0140-6736(17)30505-6
Estimates and 25-year trends of the global burden of disease attributable to ambient air pollution: an analysis of data from the Global Burden of Diseases Study 2015
Erratum in
-
Department of Error.Lancet. 2017 Jun 17;389(10087):e15. doi: 10.1016/S0140-6736(17)31221-7. Epub 2017 May 23. Lancet. 2017. PMID: 28549659 Free PMC article. No abstract available.
-
Department of Error.Lancet. 2018 Apr 21;391(10130):1576. doi: 10.1016/S0140-6736(18)30900-0. Lancet. 2018. PMID: 29695347 Free PMC article. No abstract available.
Abstract
Background: Exposure to ambient air pollution increases morbidity and mortality, and is a leading contributor to global disease burden. We explored spatial and temporal trends in mortality and burden of disease attributable to ambient air pollution from 1990 to 2015 at global, regional, and country levels.
Methods: We estimated global population-weighted mean concentrations of particle mass with aerodynamic diameter less than 2·5 μm (PM2·5) and ozone at an approximate 11 km × 11 km resolution with satellite-based estimates, chemical transport models, and ground-level measurements. Using integrated exposure-response functions for each cause of death, we estimated the relative risk of mortality from ischaemic heart disease, cerebrovascular disease, chronic obstructive pulmonary disease, lung cancer, and lower respiratory infections from epidemiological studies using non-linear exposure-response functions spanning the global range of exposure.
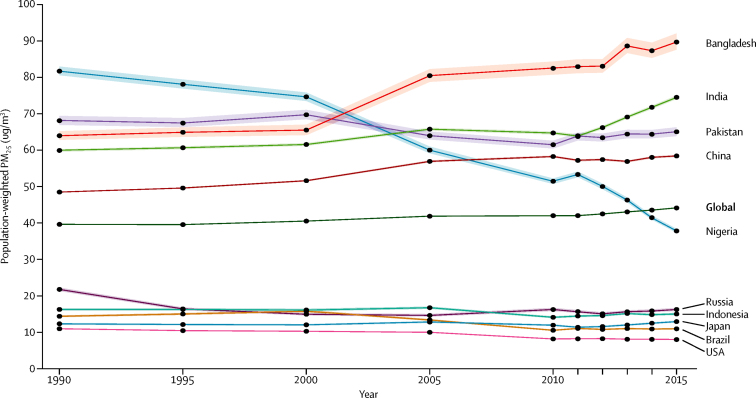
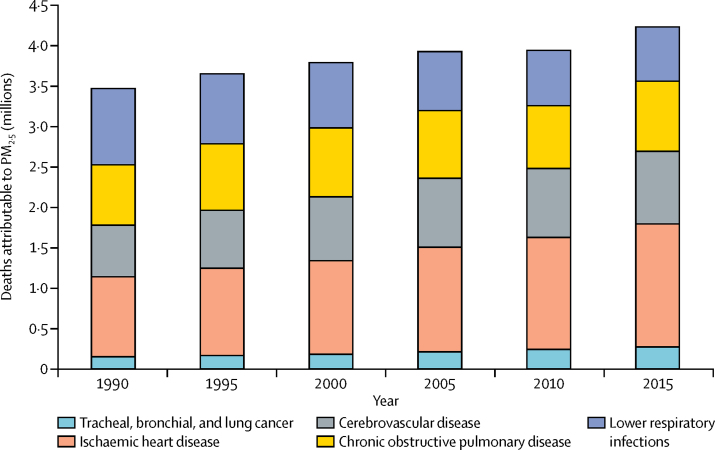
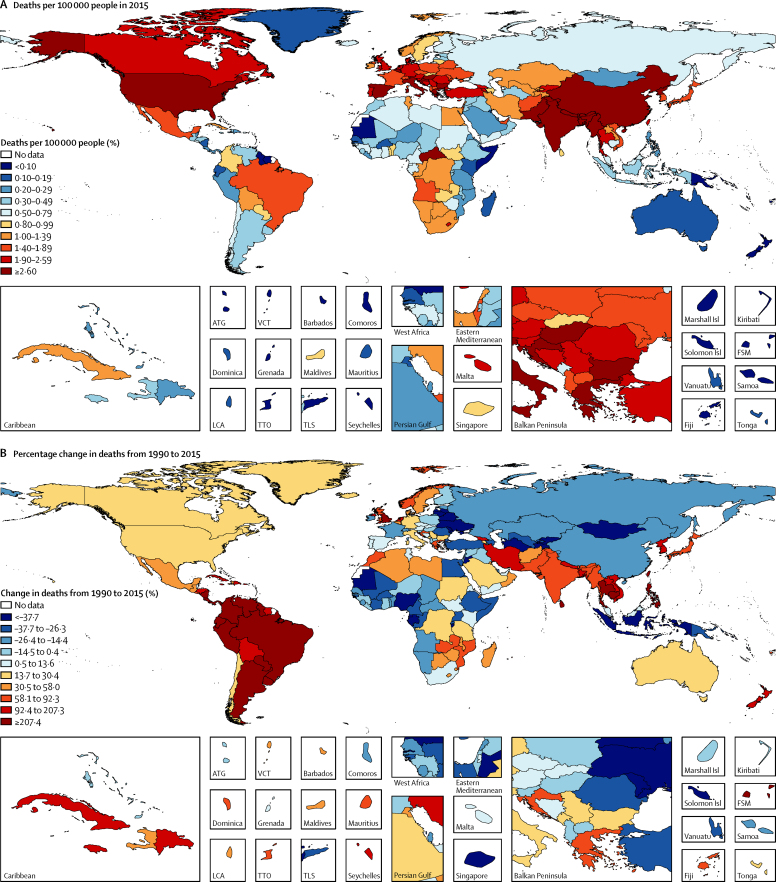
Findings: Ambient PM2·5 was the fifth-ranking mortality risk factor in 2015. Exposure to PM2·5 caused 4·2 million (95% uncertainty interval [UI] 3·7 million to 4·8 million) deaths and 103·1 million (90·8 million 115·1 million) disability-adjusted life-years (DALYs) in 2015, representing 7·6% of total global deaths and 4·2% of global DALYs, 59% of these in east and south Asia. Deaths attributable to ambient PM2·5 increased from 3·5 million (95% UI 3·0 million to 4·0 million) in 1990 to 4·2 million (3·7 million to 4·8 million) in 2015. Exposure to ozone caused an additional 254 000 (95% UI 97 000-422 000) deaths and a loss of 4·1 million (1·6 million to 6·8 million) DALYs from chronic obstructive pulmonary disease in 2015.
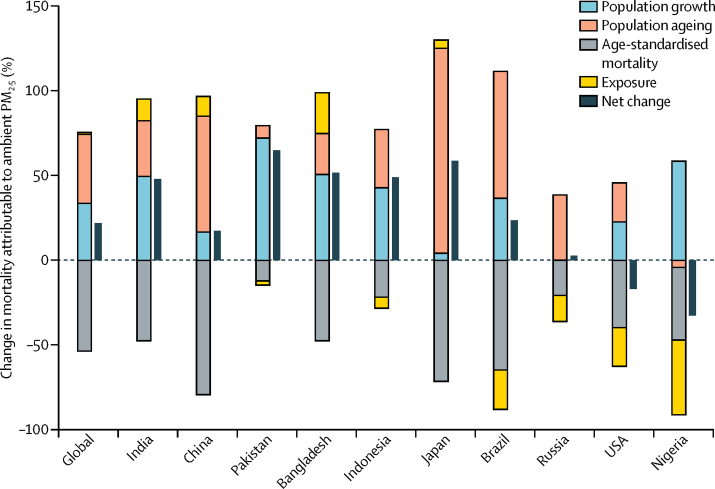
Interpretation: Ambient air pollution contributed substantially to the global burden of disease in 2015, which increased over the past 25 years, due to population ageing, changes in non-communicable disease rates, and increasing air pollution in low-income and middle-income countries. Modest reductions in burden will occur in the most polluted countries unless PM2·5 values are decreased substantially, but there is potential for substantial health benefits from exposure reduction.
Funding: Bill & Melinda Gates Foundation and Health Effects Institute.
Copyright © 2017 The Author(s). Published by Elsevier Ltd. This is an Open Access article under the CC BY 4.0 license. Published by Elsevier Ltd.. All rights reserved.
Figures

Comment in
-
Tallying the bills of mortality from air pollution.Lancet. 2017 May 13;389(10082):1862-1864. doi: 10.1016/S0140-6736(17)30884-X. Epub 2017 Apr 10. Lancet. 2017. PMID: 28408085 No abstract available.
-
Extreme pollution, climate change, and depression.Environ Sci Pollut Res Int. 2019 Aug;26(22):22103-22105. doi: 10.1007/s11356-019-05727-5. Epub 2019 Jun 21. Environ Sci Pollut Res Int. 2019. PMID: 31228060 No abstract available.
References
-
- United States Environmental Protection Agency 2009 final report: integrated science assessment for particulate matter. 2009. http://cfpub.epa.gov/ncea/risk/recordisplay.cfm?deid=216546 (accessed Dec 22, 2015). - PubMed
-
- WHO Air quality guidelines—global update. 2005. http://www.who.int/phe/health_topics/outdoorair/outdoorair_aqg/en/ (accessed Dec 22, 2015).
-
- GBD 2015 Risk Factors Collaborators Global, regional, and national comparative risk assessment of 79 behavioural, environmental and occupational, and metabolic risks or clusters of risks, 1990–2015: a systematic analysis for the Global Burden of Disease Study 2015. Lancet. 2016;388:1659–1724. - PMC - PubMed
-
- GBD 2013 Risk Factors Collaborators. Forouzanfar MH, Alexander L. Global, regional, and national comparative risk assessment of 79 behavioural, environmental and occupational, and metabolic risks or clusters of risks in 188 countries, 1990–2013: a systematic analysis for the Global Burden of Disease Study 2013. Lancet. 2015;386:2287–2323. - PMC - PubMed
-
- Brauer M, Freedman G, Frostad J. Ambient air pollution exposure estimation for the Global Burden of Disease 2013. Environ Sci Technol. 2016;50:79–88. - PubMed
MeSH terms
Grants and funding
LinkOut - more resources
Full Text Sources
Other Literature Sources
Medical
Miscellaneous
