. 2017 Aug;7(8):868-883.
doi: 10.1158/2159-8290.CD-16-1032. Epub 2017 Apr 13.

Epigenetic Identity in AML Depends on Disruption of Nonpromoter Regulatory Elements and Is Affected by Antagonistic Effects of Mutations in Epigenetic Modifiers

Affiliations

Epigenetic Identity in AML Depends on Disruption of Nonpromoter Regulatory Elements and Is Affected by Antagonistic Effects of Mutations in Epigenetic Modifiers

Jacob L Glass et al. Cancer Discov. 2017 Aug.

Abstract

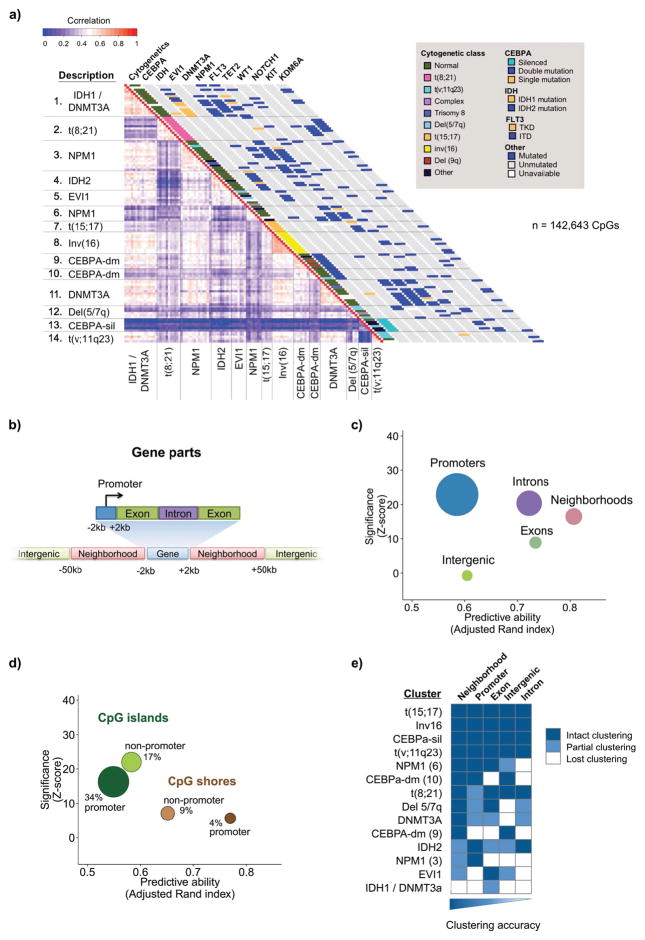
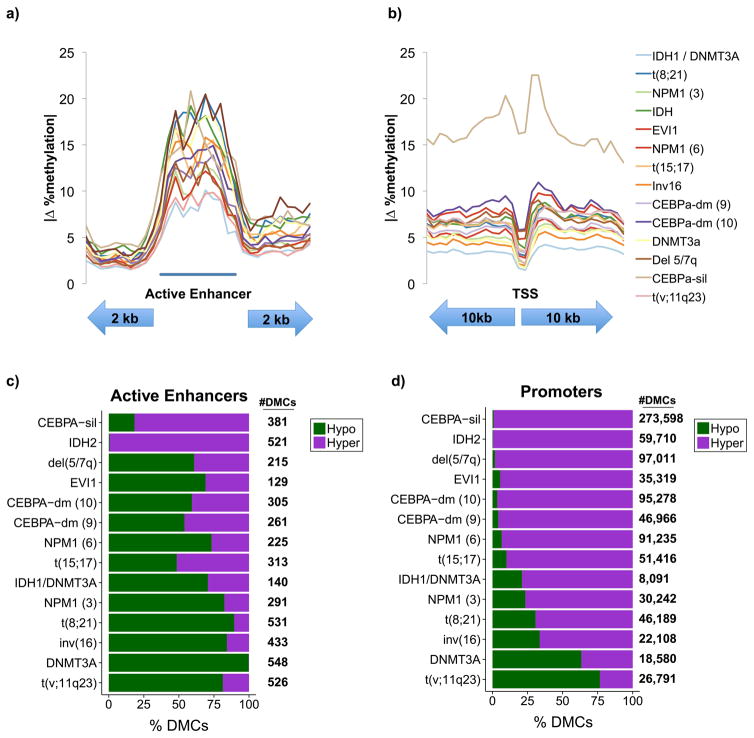
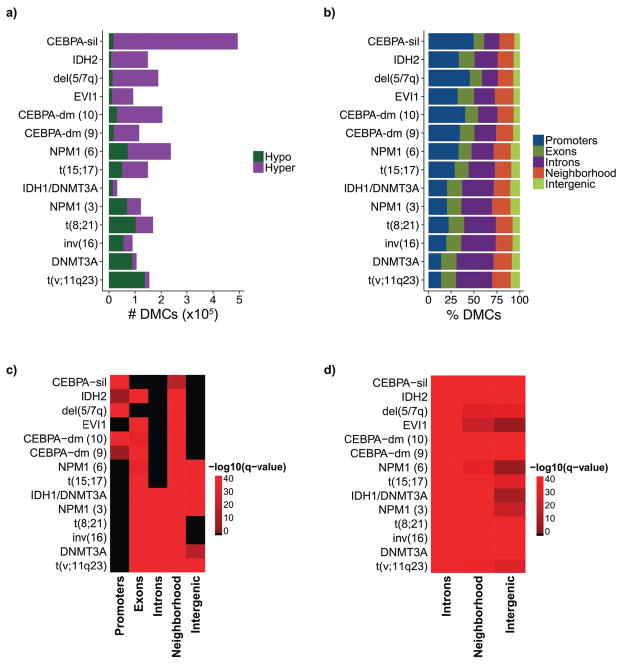
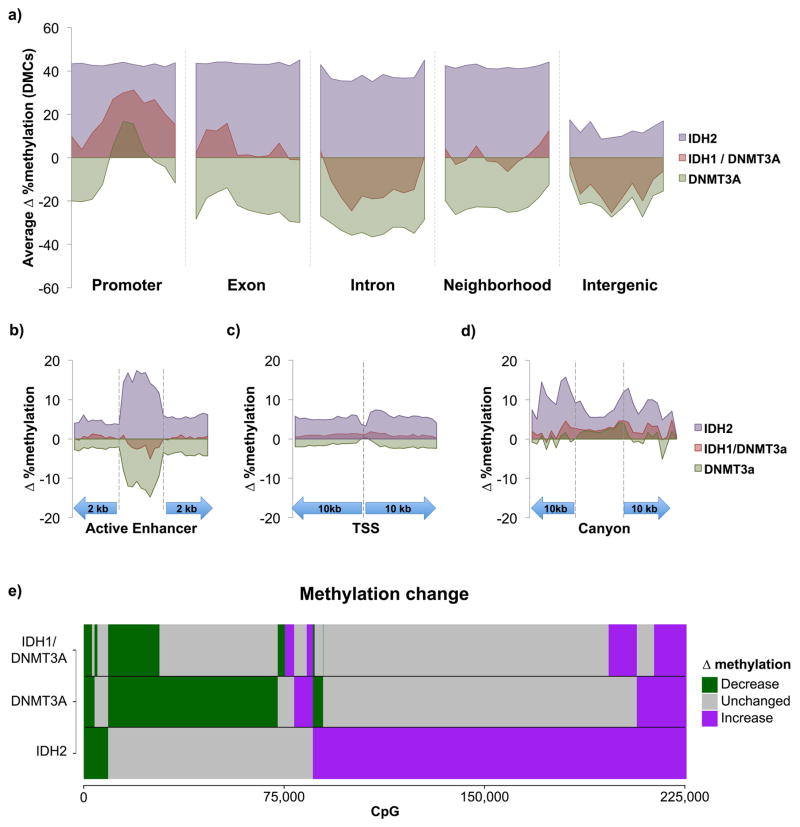
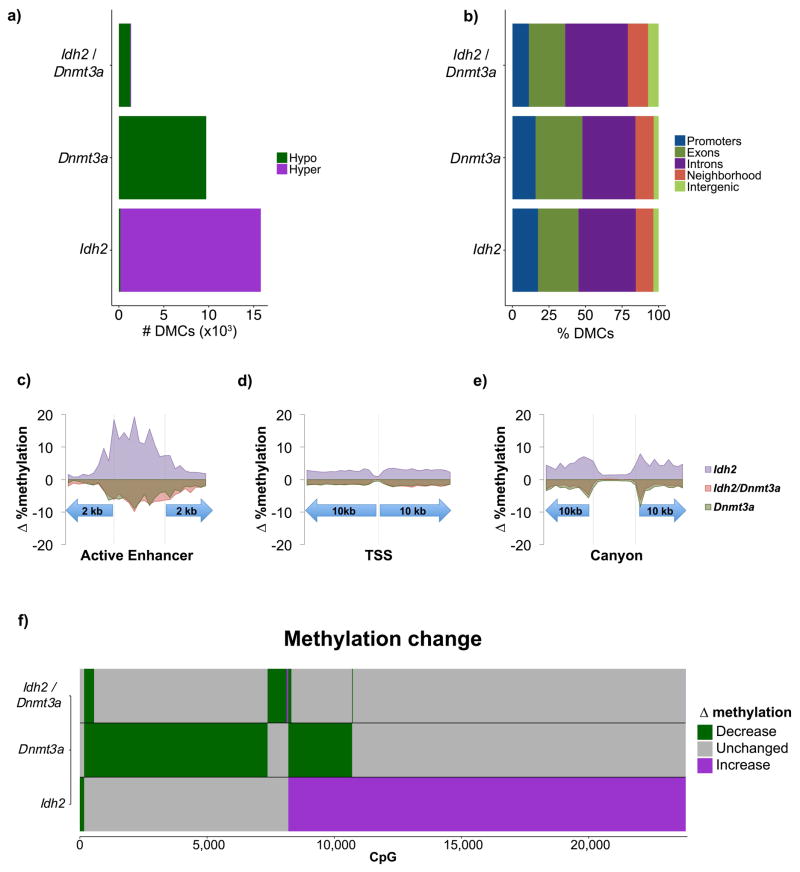
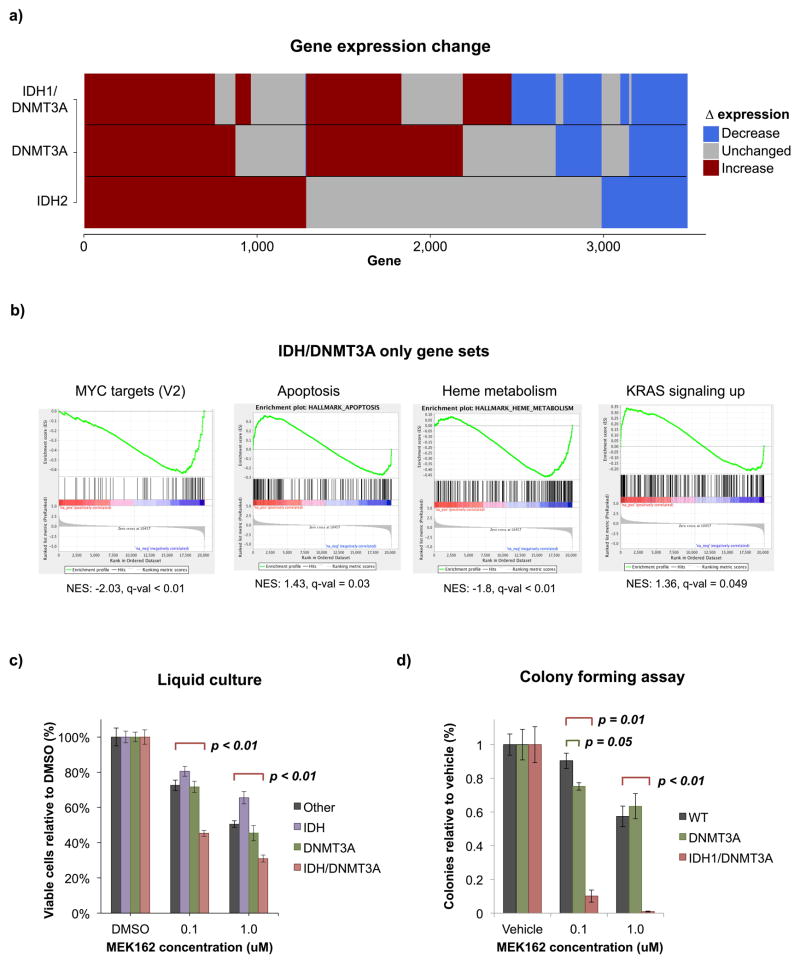
We performed cytosine methylation sequencing on genetically diverse patients with acute myeloid leukemia (AML) and found leukemic DNA methylation patterning is primarily driven by nonpromoter regulatory elements and CpG shores. Enhancers displayed stronger differential methylation than promoters, consisting predominantly of hypomethylation. AMLs with dominant hypermethylation featured greater epigenetic disruption of promoters, whereas those with dominant hypomethylation displayed greater disruption of distal and intronic regions. Mutations in IDH and DNMT3A had opposing and mutually exclusive effects on the epigenome. Notably, co-occurrence of both mutations resulted in epigenetic antagonism, with most CpGs affected by either mutation alone no longer affected in double-mutant AMLs. Importantly, this epigenetic antagonism precedes malignant transformation and can be observed in preleukemic LSK cells from Idh2R140Q or Dnmt3aR882H single-mutant and Idh2R140Q/Dnmt3aR882H double-mutant mice. Notably, IDH/DNMT3A double-mutant AMLs manifested upregulation of a RAS signaling signature and displayed unique sensitivity to MEK inhibition ex vivo as compared with AMLs with either single mutation.Significance: AML is biologically heterogeneous with subtypes characterized by specific genetic and epigenetic abnormalities. Comprehensive DNA methylation profiling revealed that differential methylation of nonpromoter regulatory elements is a driver of epigenetic identity, that gene mutations can be context-dependent, and that co-occurrence of mutations in epigenetic modifiers can result in epigenetic antagonism. Cancer Discov; 7(8); 868-83. ©2017 AACR.This article is highlighted in the In This Issue feature, p. 783.


Conflict of interest statement

Disclosure of potential conflict of interest: No potential conflicts of interest.

Figures

Figure 1
Figure 1. Epigenetically defined classification of AML
A: Representation of hierarchical clustering results based on ERRBS data using a correlation matrix heatmap. ERRBS defines AML subtypes with distinct molecular and cytogenetic characteristics. Groups were defined using a hierarchical clustering approach (see supplemental methods) and labeled according to their dominant distinguishing molecular and cytogenetic features. The lower triangular heatmap represents the correlation between the most divergent CpGs represented in all samples (n=142,643). Cytogenetic and specific molecular features are represented in the diagonal bars on the right. B: Schematic representation of the genomic compartments used in our analyses. C and D: relative predictive ability (x-axis) of each compartment using the adjusted Rand index to compare the clustering produced using the most divergent CpGs within each compartment to those using all highly variable CpGs. The significance of the finding for each compartment is shown on the y axis as a z score comparing the adjusted Rand index of the compartment to 500 iterations of the Rand index for the same number of CpGs selected randomly. E: Heatmap representation of the robustness of clustering for CpGs within each genomic compartment.
Figure 2
Figure 2. Differential methylation at regulatory regions
A: average absolute change in CpG methylation within active enhancer regions and flanking areas for each cluster. The region shown was analyzed in 30 bins, 10 for each flank and 10 for the active enhancer. All CpGs within covered annotated enhancers are included. B: average absolute change in CpG methylation within promoter regions with the upstream and downstream flanks represented by 15 bins each. All covered CpGs within promoters are included. C–D: stacking bar plots illustrating the proportions of hyper and hypomethylated CpGs in each cluster relative to CD34+ controls.
Figure 3
Figure 3. Genomic distribution of differential methylation relative to CD34+ controls
A: Bar plots illustrating the overall number of hyper and hypomethylated CpGs for each cluster sorted from highest to lowest percentage of hypermethylated CpGs relative to CD34+ controls. B: Stacking bar plots illustrating the proportional distribution of differentially methylated CpGs in each genomic compartment. C: Heatmap illustrating the enrichment of differentially methylated CpGs in each genomic compartment. D: Heatmap illustrating the enrichment of differentially methylated CpGs within HSPC enhancers in different genomic compartments.
Figure 4
Figure 4. Antagonism of IDH and DNMT3A mutations in AML
A; Average methylation change at differentially methylated CpGs within each mutation category across promoters, exons, introns, gene neighborhoods, and intergenic regions. B–D: Average overall methylation changes in AML relative to CD34+ controls at all covered CpGs within active enhancers, promoters, and canyons. E: Bar plots illustrating the type of methylation change relative to CD34+ controls at individual CpGs in IDH2, DNMT3A, and IDH1/DNMT3A mutant AMLs.
Figure 5
Figure 5. Mouse model of IDH2, DNMT3A, and IDH2/DNMT3A AMLs
A: Number of differentially methylated CpGs within Idh2R140Q, Dnmt3AR878H, and Idh2R140Q/Dnmt3AR878H mutant cohorts compared to normal LSK controls. B–D: Average overall methylation change in each cohort relative to normal controls within active enhancers, promoters, and canyons. E: Bar plots illustrating the type of methylation change relative to normal LSK controls in Idh2R140Q, Dnmt3AR878H, and Idh2R140Q/Dnmt3AR878H cohorts. F: Bar plots illustrating the type of methylation change relative to normal LSK controls at individual CpGs in Idh2R140Q, Dnmt3AR878H, and Idh2R140Q/Dnmt3AR878H mutant mice.
Figure 6
Figure 6. IDH1/DNMT3A expression cooperativity
A: Bar plots illustrating the type of expression change at individual genes in IDH2, DNMT3A, and IDH1/DNMT3A mutant AMLs. B: GSEA of hallmark gene sets uniquely enriched in IDH1/DNMT3A patients. C: Liquid culture assessing the sensitivity of IDH1/DNMT3A AMLs compared to those with IDH mutations or DNMT3A mutations alone. A set of AMLs containing neither mutation was also assessed (Other). Results are displayed as percentages relative to DMSO treated cells with error bars showing the standard error of the mean for 3 biological replicates each performed in 3 technical replicates. Significant changes from ‘other’ samples assessed by one-tailed t-test are shown. D: Colony forming assay assessing the sensitivity of IDH1/DNMT3A AMLs to those with DNMT3A single mutations and cord blood samples (WT) in biological duplicate with 3 technical replicates per sample. Results are displayed in % colonies relative to WT with error bars showing the standard error of the mean. Significant changes from WT assessed by one-tailed t-test are shown.

References

    1. Cancer Genome Atlas Research N. Genomic and epigenomic landscapes of adult de novo acute myeloid leukemia. The New England journal of medicine. 2013;368:2059–74. - PMC - PubMed
    1. Figueroa ME, Lugthart S, Li Y, Erpelinck-Verschueren C, Deng X, Christos PJ, et al. DNA methylation signatures identify biologically distinct subtypes in acute myeloid leukemia. Cancer cell. 2010;17:13–27. - PMC - PubMed
    1. Bullinger L, Ehrich M, Dohner K, Schlenk RF, Dohner H, Nelson MR, et al. Quantitative DNA methylation predicts survival in adult acute myeloid leukemia. Blood. 2010;115:636–42. - PubMed
    1. Figueroa ME, Abdel-Wahab O, Lu C, Ward PS, Patel J, Shih A, et al. Leukemic IDH1 and IDH2 mutations result in a hypermethylation phenotype, disrupt TET2 function, and impair hematopoietic differentiation. Cancer cell. 2010;18:553–67. - PMC - PubMed
    1. Qu Y, Lennartsson A, Gaidzik VI, Deneberg S, Karimi M, Bengtzen S, et al. Differential methylation in CN-AML preferentially targets non-CGI regions and is dictated by DNMT3A mutational status and associated with predominant hypomethylation of HOX genes. Epigenetics. 2014;9:1108–19. - PMC - PubMed

MeSH terms