. 2017 May 10;37(19):4954-4966.
doi: 10.1523/JNEUROSCI.0105-17.2017. Epub 2017 Apr 13.

Posterior Parietal Cortex Guides Visual Decisions in Rats

Affiliations

Posterior Parietal Cortex Guides Visual Decisions in Rats

Angela M Licata et al. J Neurosci. .

Abstract

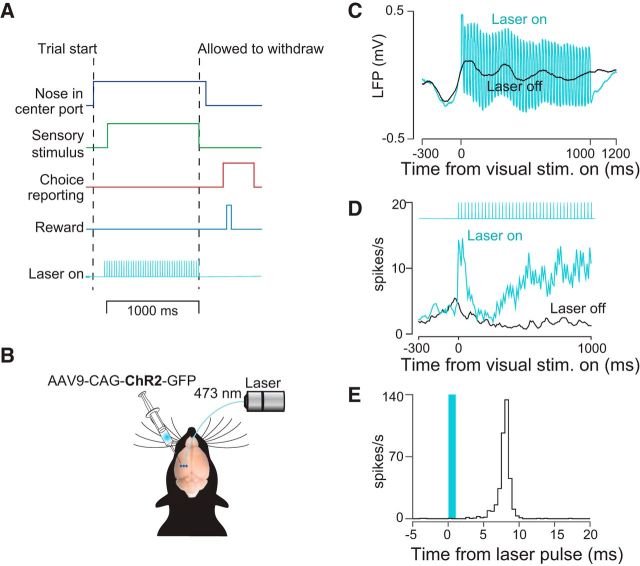
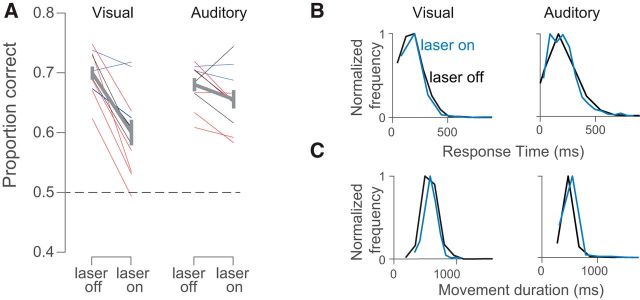
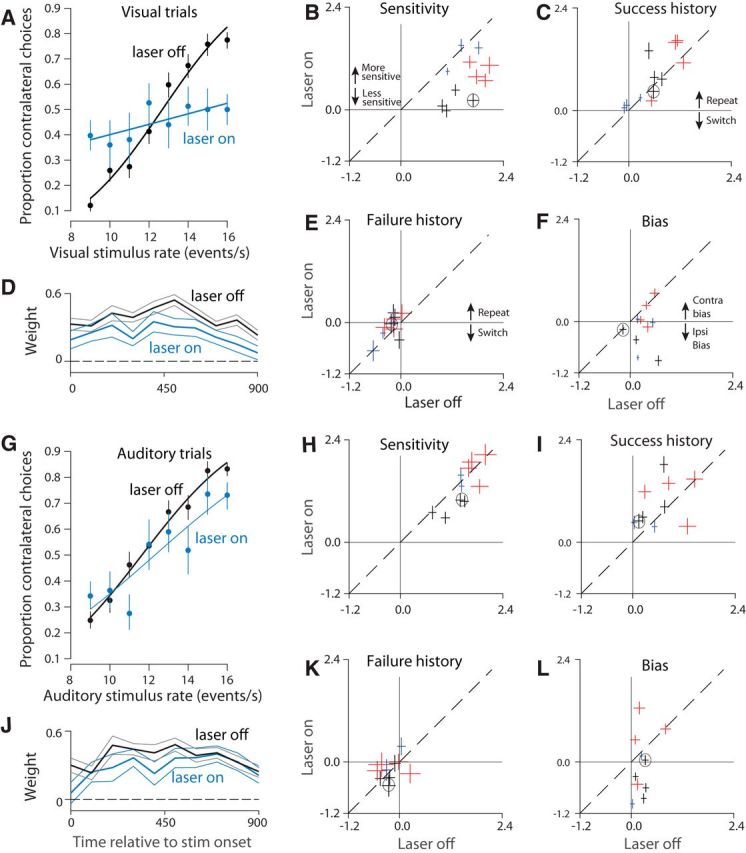
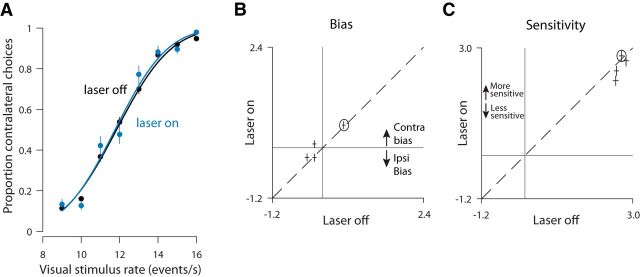
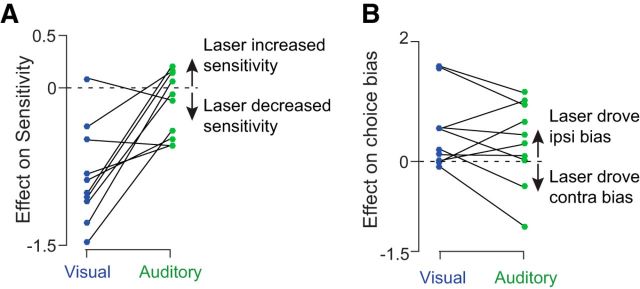
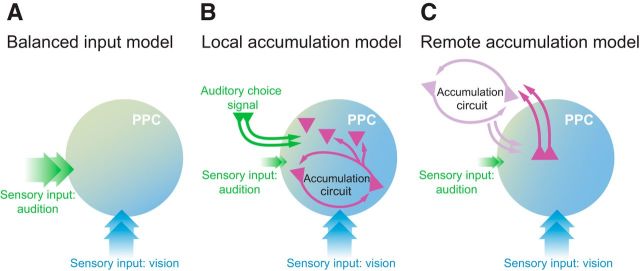
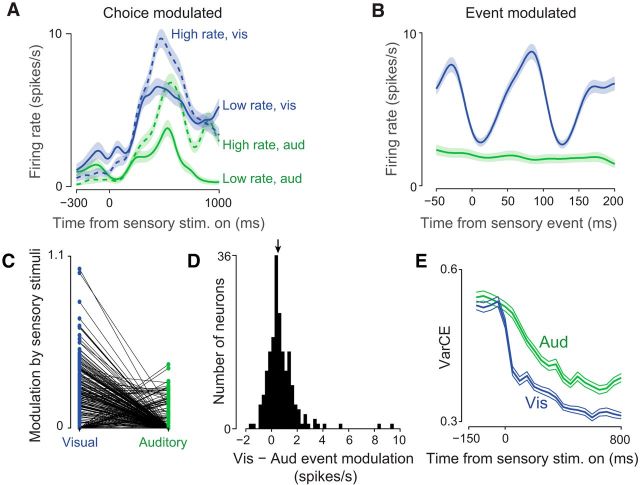
Neurons in putative decision-making structures can reflect both sensory and decision signals, making their causal role in decisions unclear. Here, we tested whether rat posterior parietal cortex (PPC) is causal for processing visual sensory signals or instead for accumulating evidence for decision alternatives. We disrupted PPC activity optogenetically during decision making and compared effects on decisions guided by auditory versus visual evidence. Deficits were largely restricted to visual decisions. To further test for visual dominance in PPC, we evaluated electrophysiological responses after individual sensory events and observed much larger response modulation after visual stimuli than auditory stimuli. Finally, we measured trial-to-trial spike count variability during stimulus presentation and decision formation. Variability decreased sharply, suggesting that the network is stabilized by inputs, unlike what would be expected if sensory signals were locally accumulated. Our findings suggest that PPC plays a causal role in processing visual signals that are accumulated elsewhere.SIGNIFICANCE STATEMENT Defining the neural circuits that support decision making bridges a gap between our understanding of simple sensorimotor reflexes and our understanding of truly complex behavior. However, identifying brain areas that play a causal role in decision making has proved challenging. We tested the causal role of a candidate component of decision circuits, the rat posterior parietal cortex (PPC). Our interpretation of the data benefited from our use of animals trained to make decisions guided by either visual or auditory evidence. Our results suggest that PPC plays a causal role specifically in visual decision making and may support sensory aspects of the decision, such as interpreting the visual signals so that evidence for a decision can be accumulated elsewhere.

Keywords: decision making.


Figures

Figure 1.
Figure 1.
Decision-making task and strategy for disrupting PPC activity. A, Schematic of decision-making task. Rats initiated trials by inserting their snouts into a port spanned by an infrared beam (dark blue trace). After a variable delay, a series of auditory or visual events began (green trace). Animals were required to remain in a center port for 1000 ms during which time these sensory stimuli were presented. Animals were then allowed to withdraw. They reported choices (red trace) at either a left or right decision port and were rewarded with a drop of water (light blue trace) when correct. Optogenetic stimulation (42 Hz, 5–20 mW, cyan trace) was presented throughout the 1000 ms period on randomly selected trials. B, Schematic of optogenetic approach showing unilateral injections of AAV9-CAG-ChR2-GFP into PPC. C, LFP recorded during laser-on and laser-off trials via a tetrode attached to the stimulating optical fiber. D, Peristimulus time histogram for an example well isolated single neuron for laser-on (cyan) and laser-off (black) trials. E, PETH in which responses are aligned to individual pulses of blue light.
Figure 2.
Figure 2.
Robust expression of GFP-tagged ChR2 in PPC. A, Brain section from Rat 3 showing injection site within PPC. Green scale bar, 500 μm. Yellow box indicates region that will be magnified in the subsequent panel. B, Further magnified view of the same image. Blue arrows indicate individual cells with membrane-bound GFP indicating the presence of ChR2. Green scale bar, 100 μm. C, D, Same as B but for Rats 1 and 2.
Figure 3.
Figure 3.
Stimulation drives a strong reduction in visual, but not auditory, decision accuracy and largely spares movements. A, Proportion correct for laser on versus laser off trials for visual (left) and auditory (right) trials. Each line illustrates values for a single site; lines of the same color are from the same animal (3 rats total). Thick gray line indicates mean (±SEM) for all sites. Dashed line indicates chance performance. B, Response times from an example site in one rat were similar after laser-on (blue) and laser-off (black) trials on both visual (left, 183 vs 184 ms, p = 0.16) and auditory (right, 209 vs 211 ms, p = 0.67) decisions. C, Movement durations from an example site were similar after laser-on (blue) and laser-off (black) trials on both visual (left, 588 vs 578 ms, p = 0.15) and auditory (right, 491 vs 476 ms, p = 0.01) decisions.
Figure 4.
Figure 4.
PPC disruption has a larger effect on visual, compared with auditory, decisions. A, Visual psychometric functions from stimulation in a single location within PPC (Rat 1, 1624 trials). Smooth lines are fits to the data (logistic regression). Error bars reflect the Wilson binomial confidence interval. B, Outcome of a probabilistic model that measures the effect of sensitivity to stimulus rate on decisions. The fitted parameter is plotted for stimulation (laser-on, vertical axis) versus control (laser-off, horizontal axis) trials. All values are positive, indicating that increasing stimulus rate led to more high rate decisions. Error bars indicate SEs. Dashed line, y = x. Colors: individual rats; multiple points for each animal indicate data collected from different optical fibers/depths (sites) within PPC. Black circle indicates the animal shown in A. C, Same as B but for the “success history” parameter. Positive values indicate that the rat tended to repeat rewarded decisions. D, Weighting of visual sensory evidence during 100 ms windows. Vertical axis indicates the weight for the time indicated by the corresponding value on the horizontal axis. Weights were computed via logistic regression (see Materials and Methods). Values would approximate dashed line (y = 0) for times during which sensory evidence failed to influence the choice. Black line indicates control (15,267 trials). Cyan line: stimulation (6046 trials). E, Same as B but for the “failure history” parameter. Negative values indicate the rat tended to switch after unrewarded decisions. F, Same as B but for the “bias” parameter. Zero indicates unbiased decisions; negative values indicate an ipsilateral bias. G, Auditory psychometric functions from the same rat/site as in (A) (1655 trials). H, I, K, L, Same as B, C, E, F, respectively, but for auditory trials. J, Same as D but for auditory trials. Black line indicates control (10,148 trials). Cyan line indicates stimulation (4665 trials).
Figure 5.
Figure 5.
In an uninjected rat, decisions are unaffected by blue light. A, Psychometric functions for sessions in which a single laser was used and black tape was applied to prevent light from escaping the sides of the implanted chamber (5781 trials). No effect was seen on choice (p = 0.33) or sensitivity (p = 0.31). B, C, Effects on bias and sensitivity from four experiments (same conventions as in Fig. 4B,F) for the animal in A. The site in A is indicated by the circled points. Solid lines indicate 0.
Figure 6.
Figure 6.
Site-by-site comparison of stimulation effects on bias and sensitivity for auditory and visual trials. Each point was computed by taking the difference in the regression coefficients between stimulation and control trials for each modality at each stimulation site in the three rats. Coefficients obtained from auditory and visual trials at the same stimulation site (interleaved trials) are connected with a solid line. Dashed line at 0 indicates no effect of stimulation. A, Stimulation caused a larger reduction on visual sensitivity (blue points) compared with auditory sensitivity (green points). This difference was significant (t test, p = 0.0021). B, Stimulation caused a larger ipsilateral bias on visual (blue) compared with auditory (green) decisions. However, this difference did not reach significance (t test, p = 0.29).
Figure 7.
Figure 7.
Putative models for PPC's role in a decision circuit. A, Balanced input model that is unsupported by the disruption experiment. B, Local accumulation model in which visual inputs to PPC are stronger than auditory inputs and evidence over time is accumulated within PPC. Visual choice signals are therefore computed locally within PPC as the output of the accumulation circuit (pink). Auditory information is accumulated elsewhere and fed back to PPC (green arrows). C, Remote accumulation model in which visual inputs to PPC are stronger than auditory inputs and evidence over time is accumulated at a remote location and fed back to PPC.
Figure 8.
Figure 8.
Electrophysiological analyses suggesting that PPC discriminates individual visual events and does not act as an evidence accumulator. A, Trial-averaged peristimulus time histogram for an example neuron. Solid traces indicate low-rate trials; dashed traces, high-rate trials; blue traces, visual trials; and green traces, auditory trials. Transparent fills show SEM. Outcome of the decision (dashed vs solid lines) and the stimulus modality (blue vs green lines) drove slow modulations over the 1000 ms decision. B, PETH for same neuron as in A aligned to individual visual or auditory events (see Materials and Methods). Same color conventions as A; only responses to low rate trials are shown. C, Modulation strength of each neuron by visual (blue) and auditory (green) events. Vertical axis indicates spikes per second plotted on a log scale. Data are aggregated across five animals. The two measurements for each neuron are connected by a line. Note that, after correcting for noise, many neurons had a modulation index of 0. D, Histogram over neurons of the modulation index for visual minus the index for auditory (same dataset as in C). Neurons with both modulation indices equal to 0 were excluded. Arrow shows median (0.68; p < 10−10, sign test). E, VarCE computed relative to stimulus onset for auditory (green) and visual (blue) trials.

References

    1. Andermann ML, Kerlin AM, Roumis DK, Glickfeld LL, Reid RC (2011) Functional specialization of mouse higher visual cortical areas. Neuron 72:1025–1039. 10.1016/j.neuron.2011.11.013 - DOI - PMC - PubMed
    1. Anikeeva P, Andalman AS, Witten I, Warden M, Goshen I, Grosenick L, Gunaydin LA, Frank LM, Deisseroth K (2011) Optetrode: a multichannel readout for optogenetic control in freely moving mice. Nat Neurosci 15:163–170. 10.1038/nn.2992 - DOI - PMC - PubMed
    1. Aravanis AM, Wang LP, Zhang F, Meltzer LA, Mogri MZ, Schneider MB, Deisseroth K (2007) An optical neural interface: in vivo control of rodent motor cortex with integrated fiberoptic and optogenetic technology. J Neural Eng 4:S143–156. 10.1088/1741-2560/4/3/S02 - DOI - PubMed
    1. Boyden ES, Zhang F, Bamberg E, Nagel G, Deisseroth K (2005) Millisecond-timescale, genetically targeted optical control of neural activity. Nat Neurosci 8:1263–1268. 10.1038/nn1525 - DOI - PubMed
    1. Brody CD, Hanks TD (2016) Neural underpinnings of the evidence accumulator. Curr Opin Neurobiol 37:149–157. 10.1016/j.conb.2016.01.003 - DOI - PMC - PubMed

Publication types

LinkOut - more resources