The MYC mRNA 3'-UTR couples RNA polymerase II function to glutamine and ribonucleotide levels
- PMID: 28408437
- PMCID: PMC5494468
- DOI: 10.15252/embj.201796662
The MYC mRNA 3'-UTR couples RNA polymerase II function to glutamine and ribonucleotide levels
Abstract
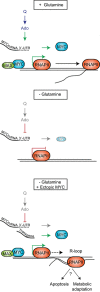
Deregulated expression of MYC enhances glutamine utilization and renders cell survival dependent on glutamine, inducing "glutamine addiction". Surprisingly, colon cancer cells that express high levels of MYC due to WNT pathway mutations are not glutamine-addicted but undergo a reversible cell cycle arrest upon glutamine deprivation. We show here that glutamine deprivation suppresses translation of endogenous MYC via the 3'-UTR of the MYC mRNA, enabling escape from apoptosis. This regulation is mediated by glutamine-dependent changes in adenosine-nucleotide levels. Glutamine deprivation causes a global reduction in promoter association of RNA polymerase II (RNAPII) and slows transcriptional elongation. While activation of MYC restores binding of MYC and RNAPII function on most promoters, restoration of elongation is imperfect and activation of MYC in the absence of glutamine causes stalling of RNAPII on multiple genes, correlating with R-loop formation. Stalling of RNAPII and R-loop formation can cause DNA damage, arguing that the MYC 3'-UTR is critical for maintaining genome stability when ribonucleotide levels are low.
Keywords: MYC; 3′‐UTR; RNA polymerase II; glutamine.
© 2017 The Authors.
Figures
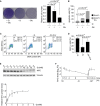
Effects of glucose (Glc) or glutamine (Q) deprivation on cell growth. Colonies were stained with crystal violet after starvation for 36 h. Quantification of three independent experiments is shown on the right. Results represent mean + SD. P‐values were calculated using Student's t‐test.
FACS analysis showing the percentage of early apoptotic (AnnV+; Ann: annexin) and late apoptotic (AnnV+/PI+; PI: propidium iodide) HCT116 cells after 36 h of starvation. Results represent mean + SD (n = 3). P‐values were calculated for all apoptotic cells using Student's t‐test.
FACS analysis of BrdU/PI‐stained cells. Cells were grown in complete medium or medium without glutamine for 15 h. Where indicated, glutamine was re‐added for 8 h. Cells were labeled with BrdU for 1 h.
Quantification of BrdU‐positive cells. Results represent mean + SD (n = 4). P‐values were calculated using Student's t‐test.
Top: Immunoblot documenting MYC protein levels in HCT116 cells cultured in medium containing the indicated amounts of glutamine for 24 h (n = 3). Bottom: Quantification of three independent experiments. Each point represents mean ± SD. Curve fitting was performed using a sigmoidal dose–response equation.
Time course of MYC protein levels in cells starved for 15 h, followed by re‐addition of glutamine at the indicated time points. Each value was normalized to +Q at time point 0. Results represent mean ± SD (n = 4).
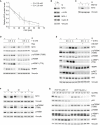
Quantification of immunoblots documenting MYC levels at the indicated times after addition of cycloheximide (CHX) to HCT116 cells cultured in medium containing 2 mM or 0.5 mM glutamine for 24 h. Each point shows mean ± SD (n = 3).
Immunoblots documenting levels of c‐JUN, MCL‐1, and cyclin E before and after glutamine withdrawal for 1 h.
Immunoblot documenting MYC levels in the presence of the proteasomal inhibitor MG132. Cells were cultured for 15 h in medium containing or lacking glutamine and treated with 20 μM MG132 or EtOH for 6 h.
Immunoblots documenting levels of the indicated proteins and phosphoproteins in HCT116 cells pre‐treated with rapamycin (Rap) or DMSO for 2 h and starved for 15 h in the presence of rapamycin. Glutamine was re‐added after starvation for the indicated time points (n = 2).
The experiment was performed as described in (C) using the inhibitor OSI‐027.
Immunoblots showing levels of the indicated proteins and phosphoproteins in cells cultured for 15 h in the presence or absence of the indicated amino acids (M = methionine; L = leucine). Each amino acid was re‐added for 2 h after starvation (−/+) (n = 3).
Immunoblots documenting levels of the indicated proteins and phosphoproteins in wild‐type (p53+/+) or p53‐deficient (p53−/−) HCT116 cells cultured in medium containing the indicated amounts of glutamine for 15 h (n = 2).
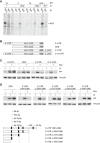
35S‐methionine labeling of HCT116 followed by immunoprecipitation with α‐MYC or control antibodies. Glutamine starvation was performed for 2 or 15 h. Where indicated, adenosine (Ado, 150 μM) was supplemented or re‐added to the medium after starvation. The arrow indicates the specific MYC band detected by autoradiography (n = 2).
Diagram depicting the doxycycline (Dox)‐inducible MYC constructs used for lentiviral infection of HCT116 cells. All constructs contain a carboxy‐terminal HA‐tag. CDS, coding sequence.
Immunoblot documenting levels of ectopically expressed MYC. Glutamine starvation was started after 2 h of Dox‐mediated induction and maintained for 15 h in the presence of Dox. Exogenous MYC levels were detected by α‐HA immunoblot (n = 3).
Top: Immunoblot showing levels of exogenous MYC. The experiment was performed as in (C), using Dox‐inducible MYC constructs (n = 3). CDS and 3′‐UTR constructs are described in (A). Four 3′‐UTR deletions are depicted at the bottom. Numbers refer to the annotated MYC sequence NM_002467.4. Vertical dashed lines indicate the region responsible for MYC regulation. Black boxes indicate the position of the AU‐rich elements (AUUUA sequences) present in MYC 3′‐UTR. Gray dashes indicate the predicted binding sites of miRNAs (shown in Appendix Fig S3).

Top: Scheme of the constructs used. Bottom: Immunoblot from HCT116 cells expressing the indicated MYC constructs and treated as shown.
Quantification of exogenous MYC levels. The graphs show mean expression + SD of each construct relative to expression in the presence of glutamine (n = 3). P‐values were calculated using Student's t‐test.
qRT–PCR assays showing levels of HA‐tagged MYC mRNA in Dox‐induced cells. HA‐MYC mRNA in the presence or absence of glutamine is each shown relative to CDS values. Results represent mean + SD (n = 3). P‐values were calculated using Student's t‐test.

Immunoblot of HCT116 cells stably expressing the indicated MYC‐ER constructs or empty vector (EV) as control. MYC‐ER activity was induced overnight with 20 nM 4‐hydroxytamoxifen (OHT), followed by 24 h of glutamine starvation in the presence of OHT (n = 4).
Crystal‐violet‐stained tissue culture plates documenting growth of HCT116 cells cultured in glutamine‐depleted medium for 48 h in the presence of OHT.
Quantification of relative cell number at the indicated time points after glutamine starvation. Each sample was normalized to the value obtained after 48 h of starvation. Each point represents the mean ± SD (n = 3). P‐values were calculated using Student's t‐test, comparing EV or MYC‐ER‐3′‐UTR to MYC‐ER.
PI‐FACS documenting number of HCT116 cells with a sub‐G1 DNA content after 72 h of glutamine starvation. Results show mean + SD (n = 3). P‐values were calculated using Student's t‐test.
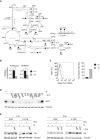
Diagram summarizing main glutamine‐dependent metabolic pathways. Filled dots indicate the metabolites used in this study.
Relative concentrations of putrescine and ornithine after 15 h of glutamine starvation in HCT116 cells, normalized to +Q. Data represent mean ratios + SD (n = 6, each measurement carried out in duplicates). P‐values were calculated using Student's t‐test (***P < 0.001; **P < 0.01).
FACS assays of 2′,7′‐dichlorofluorescin diacetate (DCFDA)‐stained HCT116 cells documenting levels of reactive oxygen species in control cells and after 15 h of glutamine starvation. The right panel shows the quantification of a representative experiment (n = 2).
Immunoblot of glutamine‐starved cells (15 h) after addition of the indicated substrates, either alone or in combination, for 2 h: Nucls: nucleosides; GSH‐MEE: glutathione‐reduced ethyl ester; DMKG: dimethyl‐α‐ketoglutarate; DMS: dimethyl succinate; Pyr: sodium pyruvate; Glu: glutamate; Q: glutamine
(Left) α‐HA immunoblot of HCT116 cells expressing the indicated Dox‐inducible constructs and cultured with or without Ado in glutamine‐depleted medium for 2 h (n = 3). (Right) α‐HA immunoblot of cells that were glutamine‐starved for 15 h, followed by re‐addition of the indicated substrates for 2 h (n = 2).

Concentrations of selected metabolites after 2 and 15 h of glutamine starvation in HCT116 cells relative to non‐starved cells. Glu: glutamate; α‐KG: α‐ketoglutarate; Fum: fumarate; Mal: malate; DHAP: dihydroxyacetone phosphate; Pyr: pyruvate; Lac: lactate. Data show mean ratios + SD (n = 6, each measurement performed in technical duplicates). P‐values were calculated using Student's t‐test (***P < 0.001; **P < 0.01; *P < 0.05).
Concentrations of nucleotides in HCT116 cells that were glutamine‐starved for 15 h, followed by re‐addition of the indicated substrates for 2 h. DMKG: dimethyl‐α‐ketoglutarate; Ado: adenosine. Values were normalized to +Q. Data represent mean ratios + SD (n = 6, each measurement carried out in triplicates). P‐values were calculated using Student's t‐test (***P < 0.001; **P < 0.01; *P < 0.05).
Immunoblot of glutamine‐starved HCT116 cells after addition of the indicated substrates. DMS: dimethyl succinate; NAC: N‐acetyl‐cysteine; Nucls: mix of five ribo‐ and deoxy‐ribonucleosides (n = 2).
Immunoblot of glutamine‐starved cells after addition of the indicated substrates. Ado: adenosine; Guo: guanosine; Urd: uridine; Cyt: cytidine; Pur: adenosine and guanosine; Pyri: cytidine and uridine; dAdo: deoxy‐adenosine; dGuo: deoxy‐guanosine; Thd: thymidine; dCyd: deoxy‐cytidine; dPur: deoxy‐adenosine and deoxy‐guanosine; dPyri: thymidine and deoxy‐cytidine (n = 3).
Concentrations of adenosine‐derived nucleotides after 2 h of glutamine starvation in HCT116 cells, relative to non‐starved cells. Data represent mean ratios + SD (n = 6, each measurement carried out in triplicates). P‐values were calculated using Student's t‐test (**P < 0.01; *P < 0.05).
Numbers of HCT116 cells grown for 48 h in media supplemented with the indicated substrates. Cell numbers were determined at 0 and 48 h and shown relative to 0 h. Results represent mean + SD (n = 5, each measurement carried out in duplicates). P‐values were calculated using Student's t‐test (***P < 0.001; **P < 0.01).
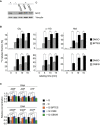
Immunoblot showing MYC levels in glutamine‐starved HCT116 cells or treated with 10 μM of the indicated inhibitors for 15 h (n = 2).
Relative 13C incorporation into the indicated metabolites 45 min after addition of 13C‐glutamine to starved HCT116 cells in the presence of BPTES (10 μM), CB839 (10 μM), or DMSO as solvent control.
Concentrations of adenosine‐derived nucleotides in cells that were glutamine‐starved for 15 h, followed by re‐addition of the indicated inhibitors for 2 h, relative to non‐starved cells.
Relative concentrations of the indicated metabolites in glutamine‐starved HCT116 cells. MYC‐ER activity was induced for 8 h with 100 nM 4‐hydroxytamoxifen (OHT), followed by 15 h of glutamine starvation in the presence of OHT. Values were normalized to EV. Data represent mean ratios ± SD (n = 6 each, nucleotide measurements carried out in triplicates, central carbon metabolites in duplicates).
FACS assays of 2′,7′‐dichlorofluorescin diacetate (DCFDA)‐stained cells. HCT116 cells were treated with 100 nM OHT and then glutamine‐starved for 24 h, in the presence of OHT (n = 2).
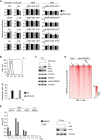
Immunoblot showing levels of MYC, RNAPII and pSer2 RNAPII under the conditions used to perform ChIP sequencing (n = 3).
Heat map documenting binding of RNAPII at the TSS and of pSer2 RNAPII at the TES for all genes with detectable RNAPII binding under the indicated conditions.
Left: ChIP experiment documenting RNAPII binding to the TSS of the indicated genes and an intergenic control region. Bars represent mean + SD of technical triplicates. Right: Immunoblot documenting MYC levels under the experimental conditions used to perform ChIP experiment. Cells were cultured in presence or absence of glutamine for 3.5 h. Where indicated, 300 μM of Ado was supplemented to the medium.
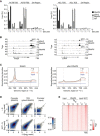
ChIP experiment documenting RNAPII binding to the transcription start site (TSS) and transcription end site (TES) of the ACTB and NCL genes and an intergenic control region (same for both targets). MYC‐ER activity was induced overnight with 100 nM OHT. Cells were starved for 5 h in the presence of OHT. Bars represent mean + SD of technical triplicates.
ChIP‐sequencing tracks for PTMA and LDHA from HCT116 cells treated as in panel (A).
Metagene plots of RNAPII (left) or pSer2 RNAPII (right) for all genes with detectable RNAPII binding under the indicated conditions.
Density plots comparing occupancy by RNAPII at the TSS and by pSer2 RNAPII at the TES for all genes with detectable RNAPII binding under the indicated conditions.
Heat map showing promoter occupancy by RNAPII and by MYC for all promoters (n = 9,796) at which RNAPII binding is detectable.
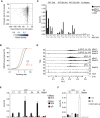
Kernel density plot documenting the effect of glutamine starvation on RNAPII occupancy at the promoter and in the gene body for all genes with detectable RNAPII binding (Δ: difference between the indicated conditions). Outliers are shown as black dots.
Traveling ratio of RNAPII under the indicated experimental conditions.
ChIP‐sequencing track showing MYC‐ER‐mediated RNAPII accumulation in the gene body (GB) of TKT. See panel (D) for position of primers.
ChIP experiment documenting RNAPII occupancy at the TSS, an intragenic site, and the TES of the TKT gene upon MYC‐ER activation. Description as in Fig 5A. Bars represent mean + SD of technical triplicates (n = 2).
DNA–RNA immunoprecipitation (DIP) showing the presence of R‐loops in the TKT gene. HCT116 cells were starved for 5 h. DNA was extracted, treated or not with RNase, and immunoprecipitated with S9.6 antibody or IgG as control. Bars represent mean ± SD of technical triplicates.
DIP assays showing R‐loops under the indicated experimental conditions. MYC‐ER‐ or EV‐expressing cells were induced overnight with 100 nM OHT and then starved for 24 h in the presence of OHT. Bars represent mean±SD of technical triplicates (n = 2)
Comment in
-
c-MYC mRNA tail tale about glutamine control of transcription.EMBO J. 2017 Jul 3;36(13):1806-1808. doi: 10.15252/embj.201796999. Epub 2017 May 15. EMBO J. 2017. PMID: 28507224 Free PMC article.
References
-
- Annibali D, Whitfield JR, Favuzzi E, Jauset T, Serrano E, Cuartas I, Redondo‐Campos S, Folch G, Gonzalez‐Junca A, Sodir NM, Masso‐Valles D, Beaulieu ME, Swigart LB, Mc Gee MM, Somma MP, Nasi S, Seoane J, Evan GI, Soucek L (2014) Myc inhibition is effective against glioma and reveals a role for Myc in proficient mitosis. Nat Commun 5: 4632 - PMC - PubMed
-
- Bhagwat SV, Gokhale PC, Crew AP, Cooke A, Yao Y, Mantis C, Kahler J, Workman J, Bittner M, Dudkin L, Epstein DM, Gibson NW, Wild R, Arnold LD, Houghton PJ, Pachter JA (2011) Preclinical characterization of OSI‐027, a potent and selective inhibitor of mTORC1 and mTORC2: distinct from rapamycin. Mol Cancer Ther 10: 1394–1406 - PubMed
-
- Bott AJ, Peng IC, Fan Y, Faubert B, Zhao L, Li J, Neidler S, Sun Y, Jaber N, Krokowski D, Lu W, Pan JA, Powers S, Rabinowitz J, Hatzoglou M, Murphy DJ, Jones R, Wu S, Girnun G, Zong WX (2015) Oncogenic Myc induces expression of glutamine synthetase through promoter demethylation. Cell Metab 22: 1068–1077 - PMC - PubMed
-
- Cannell IG, Kong YW, Johnston SJ, Chen ML, Collins HM, Dobbyn HC, Elia A, Kress TR, Dickens M, Clemens MJ, Heery DM, Gaestel M, Eilers M, Willis AE, Bushell M (2010) p38 MAPK/MK2‐mediated induction of miR‐34c following DNA damage prevents Myc‐dependent DNA replication. Proc Natl Acad Sci USA 107: 5375–5380 - PMC - PubMed
Publication types
MeSH terms
Substances
LinkOut - more resources
Full Text Sources
Other Literature Sources
Molecular Biology Databases

