. 2017 Apr;10(4):e004937.
doi: 10.1161/CIRCEP.116.004937.

Premature Ventricular Contraction Coupling Interval Variability Destabilizes Cardiac Neuronal and Electrophysiological Control: Insights From Simultaneous Cardioneural Mapping

Affiliations

Premature Ventricular Contraction Coupling Interval Variability Destabilizes Cardiac Neuronal and Electrophysiological Control: Insights From Simultaneous Cardioneural Mapping

David Hamon et al. Circ Arrhythm Electrophysiol. 2017 Apr.

Abstract

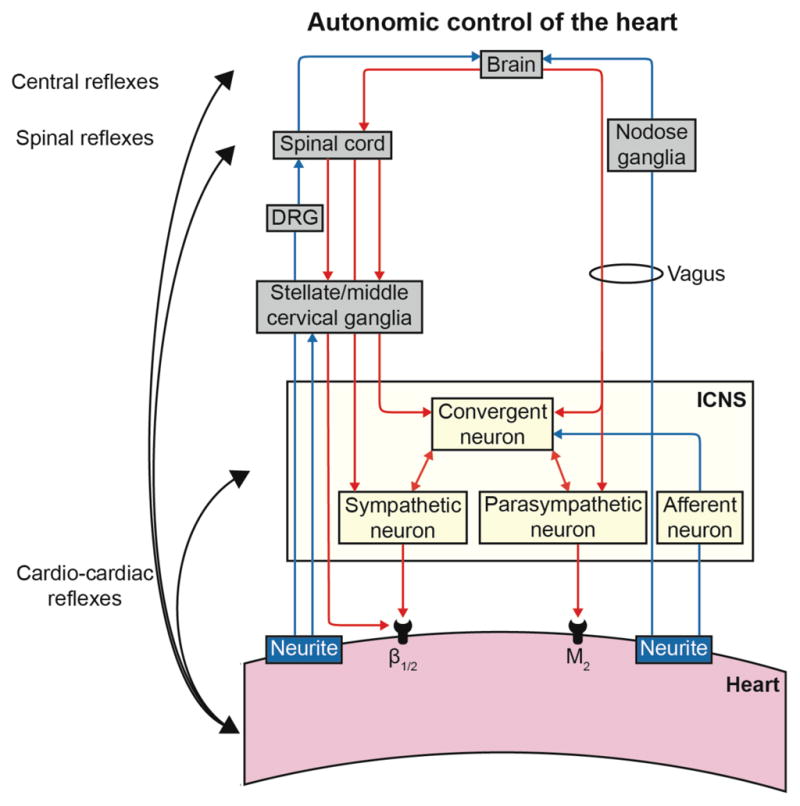
Background: Variability in premature ventricular contraction (PVC) coupling interval (CI) increases the risk of cardiomyopathy and sudden death. The autonomic nervous system regulates cardiac electrical and mechanical indices, and its dysregulation plays an important role in cardiac disease pathogenesis. The impact of PVCs on the intrinsic cardiac nervous system, a neural network on the heart, remains unknown. The objective was to determine the effect of PVCs and CI on intrinsic cardiac nervous system function in generating cardiac neuronal and electric instability using a novel cardioneural mapping approach.

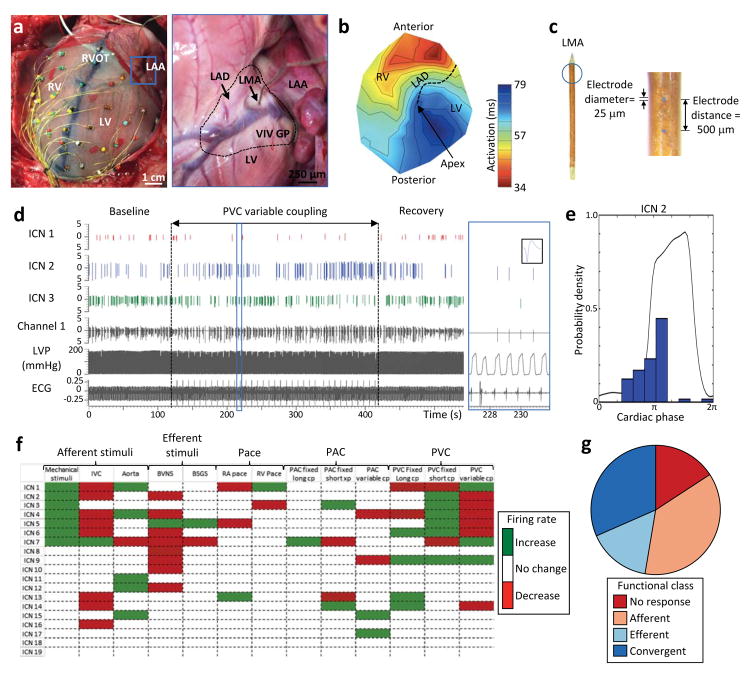
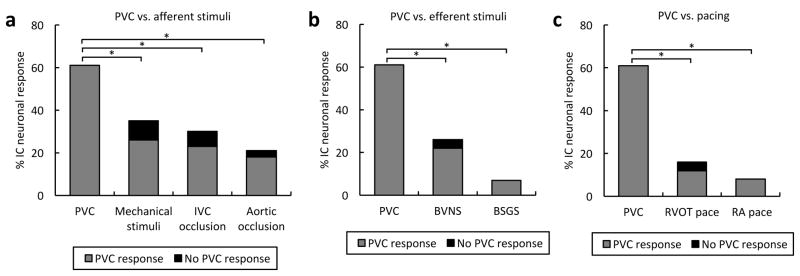
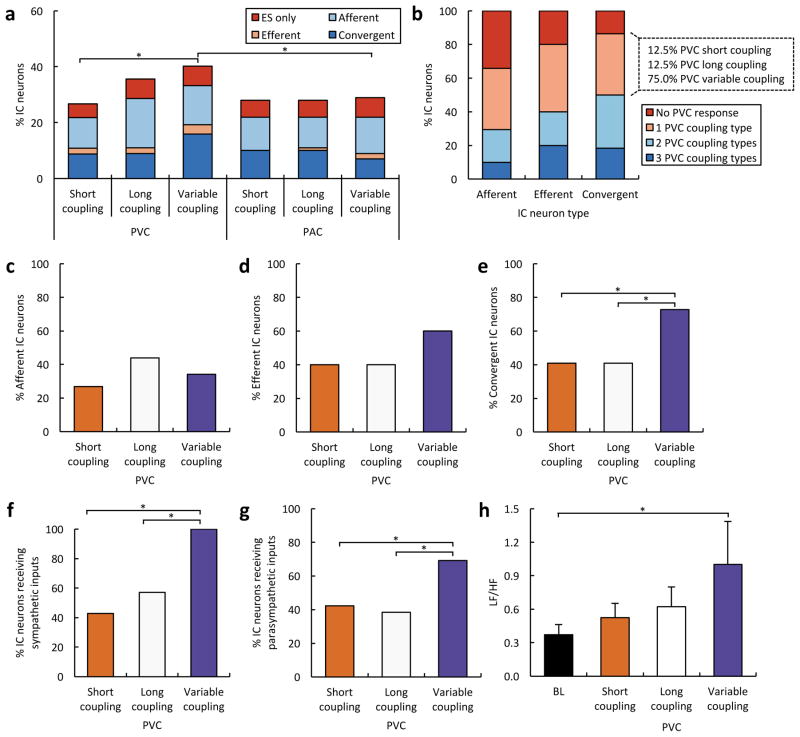
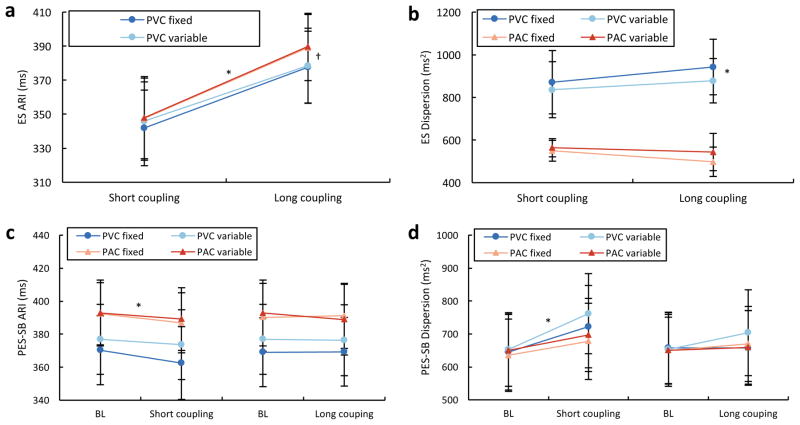
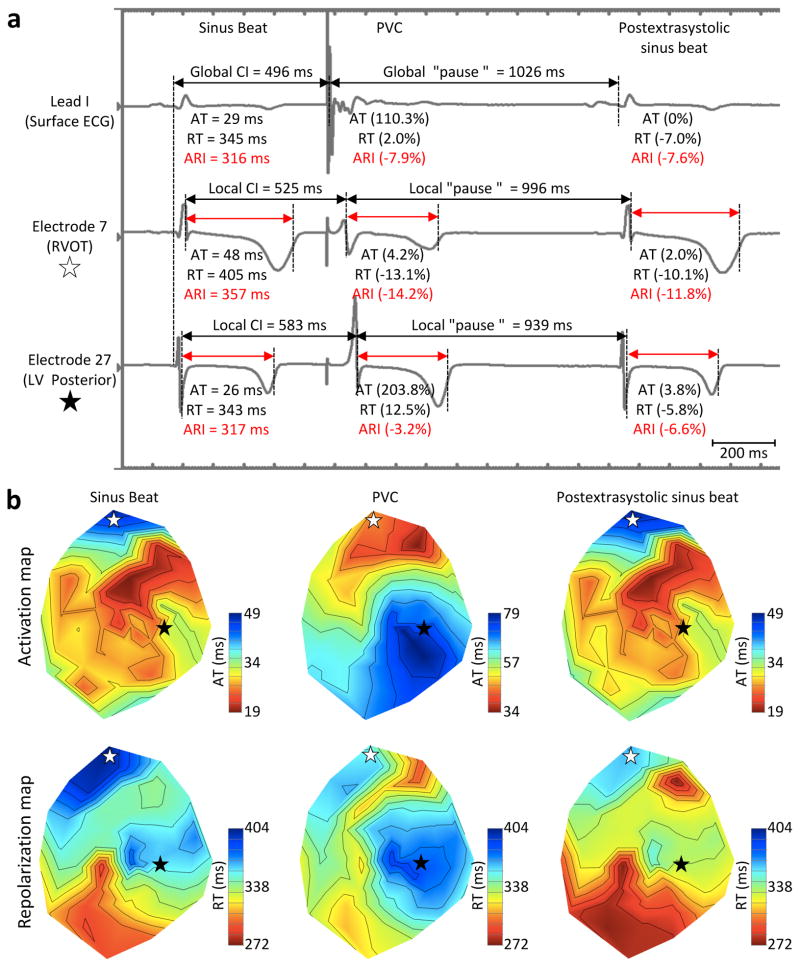
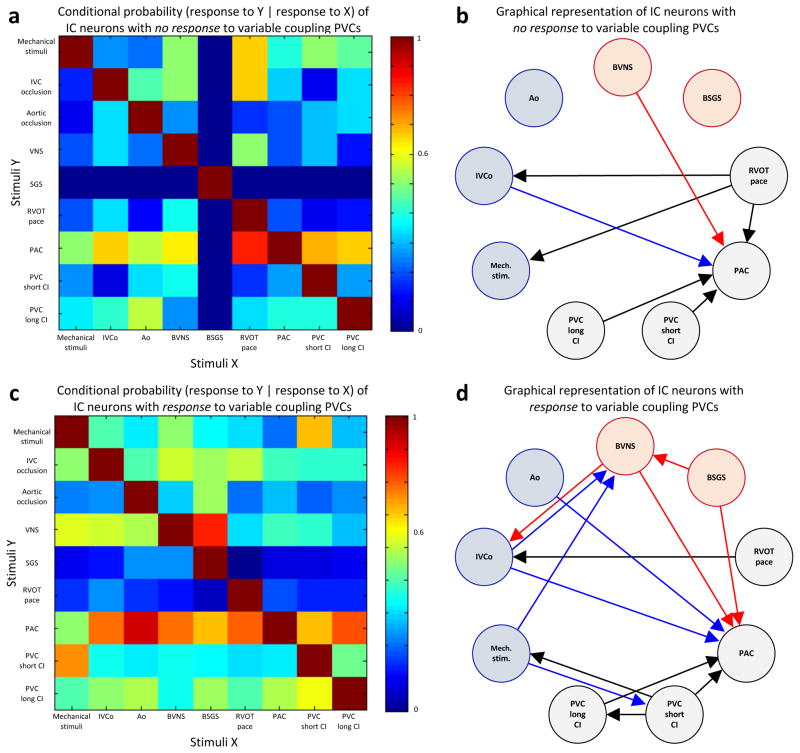
Methods and results: In a porcine model (n=8), neuronal activity was recorded from a ventricular ganglion using a microelectrode array, and cardiac electrophysiological mapping was performed. Neurons were functionally classified based on their response to afferent and efferent cardiovascular stimuli, with neurons that responded to both defined as convergent (local reflex processors). Dynamic changes in neuronal activity were then evaluated in response to right ventricular outflow tract PVCs with fixed short, fixed long, and variable CI. PVC delivery elicited a greater neuronal response than all other stimuli (P<0.001). Compared with fixed short and long CI, PVCs with variable CI had a greater impact on neuronal response (P<0.05 versus short CI), particularly on convergent neurons (P<0.05), as well as neurons receiving sympathetic (P<0.05) and parasympathetic input (P<0.05). The greatest cardiac electric instability was also observed after variable (short) CI PVCs.

Conclusions: Variable CI PVCs affect critical populations of intrinsic cardiac nervous system neurons and alter cardiac repolarization. These changes may be critical for arrhythmogenesis and remodeling, leading to cardiomyopathy.

Keywords: PVC-induced cardiomyopathy; autonomic nervous system; coupling; intrinsic cardiac ganglia; neurocardiology; premature ventricular beats.


Figures

Figure 1
Figure 1
Cardiac electrophysiological mapping and neuronal recording: methods. (A) Porcine heart with 56-electrode sock array around ventricular epicardium to record unipolar cardiac electrograms and a linear microelectrode array (LMA) in the ventral interventricular ganglionated plexus (VIV GP) to record intrinsic cardiac neuronal activity. Premature ventricular contractions (PVCs) were induced via right ventricular outflow tract (RVOT) pacing. Blue box in left panel is a higher magnification of VIV GP (blacked dashed line in right panel) with embedded LMA. (B) Representative polar activation map of PVC induced from the RVOT. Black dotted line indicates location of left anterior descending coronary artery (LAD). (C) 16-channel LMA used to record neuronal activity. (D) Representative trace showing the activity of three intrinsic cardiac neurons (ICN 1, 2 and 3) from a single electrode (channel 1) of the LMA as well as left ventricular pressure (LVP) and electrocardiogram (ECG). Black vertical dotted lines indicate the time period in which variable coupling interval PVCs were delivered. Blue box is a higher magnification of the trace with an inset showing the waveform of ICN 2. (E) Basal activity of one of the neurons from panel D (ICN 2) in relation to the cardiac cycle. Note that the activity of this neuron is predominately clustered during isovolumetric contraction. (F) Summary of evoked changes in neuronal activity in response to PVCs as well as other cardiovascular stimuli from a single animal. Horizontal rows represent the response of an individual neuron to a given stimulus (vertical columns). Green and red indicate significant increase or decreases in activity (P<0.05), respectively. (G) Functional classification of neurons depicted in panel F. Neurons were classified as afferent, efferent, or convergent based on their responses to the cardiovascular stimuli. Afferent neurons were defined as those that responded only to epicardial mechanical stimuli of the right (RV) or left ventricle (LV); transient occlusion of the inferior vena cava (IVC); and/or transient occlusion of the descending thoracic aorta. Efferent neurons were defined as those that responded only to electrical stimulation of the bilateral vagus nerves (BVNS) and/or stellate ganglia (BSGS). Neurons that responded to activation of both afferent and efferent inputs were defined as convergent. PAC, premature atrial contraction; RA, right atrium.
Figure 2
Figure 2
PVCs are a powerful and unique cardiovascular stimulus. (A) Percentage of intrinsic cardiac (IC) neurons responding to premature ventricular contractions (PVCs) versus afferent cardiovascular stimuli. (B) Percentage of neurons responding to PVCs versus efferent cardiovascular stimuli. (C) Percentage of neurons responding to PVCs versus pacing. Note that the vast majority of neurons that responded to afferent and efferent cardiovascular stimuli, as well as pacing, also responded to PVCs. BSGS, bilateral stellate ganglia stimulation; BVNS; bilateral vagus nerve stimulation; IVC, inferior vena cava; RA, right atrium; RVOT, right ventricular outflow tract. *, P<0.001.
Figure 3
Figure 3
Impact of PVC coupling interval on intrinsic cardiac neurons. (A) Functional classification of intrinsic cardiac (IC) neurons responding to premature ventricular (PVCs) and atrial contractions (PAC) of different coupling intervals. Note that a subset of neurons responded only to the extrasystole (ES), and none of the other afferent and efferent cardiovascular stimuli. (B) Percentage afferent, efferent and convergent neurons that responded to multiple PVC types. Note that of convergent neurons that responded to only one PVC, the vast majority responded to variable coupling interval PVCs. (C) Percentage of afferent neurons responding to PVCs of different coupling intervals. (D) Percentage of efferent neurons responding to PVCs of different coupling intervals. (E) Percentage of convergent neurons responding to PVCs of different coupling intervals. (F) Percentage of neurons receiving sympathetic inputs from the stellate ganglia responding to PVCs of different coupling intervals. (G) Percentage of neurons receiving parasympathetic inputs from the vagus nerve responding to PVCs of different coupling intervals. (H) Low frequency (LF)/high frequency (HF) ratio following PVCs of different coupling intervals versus baseline (BL). *, P<0.05.
Figure 4
Figure 4
Impact of PVCs coupling interval on cardiac electrophysiology. (A) Activation recovery intervals (ARIs) of ventricular and atrial extrasystolic (ES) beats of different coupling intervals. *, P<0.05 for short versus long coupling premature ventricular (PVCs) and atrial contractions (PACs). †, P<0.05 for long coupling PVCs versus PACs. (B) Dispersion of repolarization of ventricular and atrial ES beats of different coupling intervals. *, P<0.05 for short and long coupling PVCs versus PACs. (C) ARIs of postextrasystolic sinus beat (PES-SB) following PVCs and PACs of different coupling intervals versus baseline (BL) sinus beat. *, P<0.05 for fixed short coupling PACs versus BL. (D) Dispersion of ARI for PES-SB following PVCs and PACs of different coupling intervals versus BL sinus beat. *, P<0.05 for variable short coupling PVC versus BL.
Figure 5
Figure 5
PVC local coupling interval impact on repolarization. (A) Representative trace showing a sinus beat followed by a premature ventricular contraction (PVC) induced at a coupling of 496 ms and the subsequent postextrasystolic sinus beat on 1) surface ECG lead I, 2) a unipolar sock electrode recorded from the right ventricular outflow tract (RVOT), and 3) from the left ventricular (LV) posterior-apical wall. Overall, mean activation time (AT), repolarization time (RT) and activation recovery interval (ARI) across the heart as well as values recorded from RVOT and LV posterior electrodes are displayed under each respective trace. (B) Polar map showing myocardial activation during the sinus beat and the subsequent PVC and postextrasystolic beats. White and black stars indicate location of RVOT and LV posterior-apical wall electrodes, respectively. Note that the RVOT electrode, which had a shorter local CI than the LV posterior-apical one, was characterized by a greater shortening in RT that remained on the postextrasystolic-sinus beat while activation pattern was back to normal. Such PVC-induced arrhythmogenic substrate may increase the likelihood for subsequent “critically-timed” PVCs to trigger re-entry mediated ventricular arrhythmias.
Figure 6
Figure 6
Impact of variable coupling interval PVCs on ICNS network function. (A, C) Conditional probability that an intrinsic cardiac neuron that responded to one stimulus (X, x-axis) also responded to another stimulus (Y, y-axis). Panel A shows conditional probability for neurons that had no response to variable coupling interval premature ventricular contractions (PVCs), and panel B shows that of neurons that had a response to variable coupling interval PVCs. Color scale indicates level of probability of each occurrence. (B, D) Graphical representation of interdependent interactions between stimuli in neurons based on their response to variable coupling interval PVCs (panel B, no response; panel D, response). Only links with probabilities ≥0.6 are displayed. Afferent and efferent stimuli are represented by blue and red, respectively. Pacing, premature atrial contractions (PACs) and PVC are represented in black. Ao, aortic occlusion; BSGS, bilateral stellate ganglia stimulation; BVNS, bilateral vagus nerve stimulation; CI, coupling interval; IVCo, inferior vena cava occlusion; Mech., mechanical; RVOT, right ventricular outflow tract; stim., stimuli.
Figure 7
Figure 7. Autonomic control of the heart
DRG, dorsal root ganglia; ICNS, intrinsic cardiac nervous system.

References

    1. Yarlagadda RK, Iwai S, Stein KM, Markowitz SM, Shah BK, Cheung JW, Tan V, Lerman BB, Mittal S. Reversal of cardiomyopathy in patients with repetitive monomorphic ventricular ectopy originating from the right ventricular outflow tract. Circulation. 2005;112:1092–1097. - PubMed
    1. Leenhardt A, Glaser E, Burguera M, Nurnberg M, Maison-Blanche P, Coumel P. Short-coupled variant of torsade de pointes. A new electrocardiographic entity in the spectrum of idiopathic ventricular tachyarrhythmias. Circulation. 1994;89:206–215. - PubMed
    1. Viskin S, Rosso R, Rogowski O, Belhassen B. The “short-coupled” variant of right ventricular outflow ventricular tachycardia: a not-so-benign form of benign ventricular tachycardia? J Cardiovasc Electrophysiol. 2005;16:912–916. - PubMed
    1. Kawamura M, Badhwar N, Vedantham V, Tseng ZH, Lee BK, Lee RJ, Marcus GM, Olgin JE, Gerstenfeld EP, Scheinman MM. Coupling interval dispersion and body mass index are independent predictors of idiopathic premature ventricular complex-induced cardiomyopathy. J Cardiovasc Electrophysiol. 2014;25:756–762. - PubMed
    1. Bradfield JS, Homsi M, Shivkumar K, Miller JM. Coupling interval variability differentiates ventricular ectopic complexes arising in the aortic sinus of valsalva and great cardiac vein from other sources: mechanistic and arrhythmic risk implications. J Am Coll Cardiol. 2014;63:2151–2158. - PMC - PubMed

MeSH terms