. 2017 May;29(5):960-983.
doi: 10.1105/tpc.17.00060. Epub 2017 Apr 13.

Multi-Omics of Tomato Glandular Trichomes Reveals Distinct Features of Central Carbon Metabolism Supporting High Productivity of Specialized Metabolites

Affiliations

Multi-Omics of Tomato Glandular Trichomes Reveals Distinct Features of Central Carbon Metabolism Supporting High Productivity of Specialized Metabolites

Gerd U Balcke et al. Plant Cell. 2017 May.

Abstract

Glandular trichomes are metabolic cell factories with the capacity to produce large quantities of secondary metabolites. Little is known about the connection between central carbon metabolism and metabolic productivity for secondary metabolites in glandular trichomes. To address this gap in our knowledge, we performed comparative metabolomics, transcriptomics, proteomics, and 13C-labeling of type VI glandular trichomes and leaves from a cultivated (Solanum lycopersicum LA4024) and a wild (Solanum habrochaites LA1777) tomato accession. Specific features of glandular trichomes that drive the formation of secondary metabolites could be identified. Tomato type VI trichomes are photosynthetic but acquire their carbon essentially from leaf sucrose. The energy and reducing power from photosynthesis are used to support the biosynthesis of secondary metabolites, while the comparatively reduced Calvin-Benson-Bassham cycle activity may be involved in recycling metabolic CO2 Glandular trichomes cope with oxidative stress by producing high levels of polyunsaturated fatty acids, oxylipins, and glutathione. Finally, distinct mechanisms are present in glandular trichomes to increase the supply of precursors for the isoprenoid pathways. Particularly, the citrate-malate shuttle supplies cytosolic acetyl-CoA and plastidic glycolysis and malic enzyme support the formation of plastidic pyruvate. A model is proposed on how glandular trichomes achieve high metabolic productivity.


Figures

Figure 1.
Figure 1.
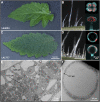
Bright-Field, Fluorescence, and Electron Microscopy of Type VI Glandular Trichomes. (A) and (C) Light microscopy: leaflets of LA4024 (A) and wild-type LA1777 (C) showing different trichome density. (B) and (D) Left side: section of leaves from LA4024 (B) and LA1777 (D) showing the epidermis and mesophyll cells; right side: fluorescence microscopy of trichome head cells from LA4024 (B) and LA1777 (D) viewed from above (top) or from the side (bottom). (E) and (F) Transmission electron microscopy: section of a leaf from LA1777 highlighting the thickness of the outer cell wall and cuticle of the epidermal cells and the cell wall of internal cells (E); head of a type VI trichome from LA1777 illustrating the size of the intercellular storage cavity and the thickness of the outer cell wall (F).
Figure 2.
Figure 2.
Principle Component Analysis of Semipolar Metabolites Measured in Negative ESI Mode. The data consist of 3476 signals, each corresponding to a unique m/z and retention time combination. Scores (A) and loadings (B). In the loading plot, the colors of the circles correspond to metabolite classes of interest, and the size of the circle reflects the average pool size of the respective metabolite over all of the samples. For simplicity, only signals that could be associated with a metabolite group are shown (in total 129). The entire data set, i.e., including unknowns, is presented in Supplemental Data Set 1. All data are weight-normalized and Pareto-scaled. FA, fatty acids; SQTCA, sesquiterpene carboxylic acid; R2X, cumulative sum of squares of the entire X explained by principal components 1 to 3. X = log-normalized peak heights relative to LA1777 leaf matter; Q2X(cum) = cumulative fraction of the total variation of X and Y that can be predicted by principal components.
Figure 3.
Figure 3.
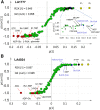
Loadings of PLS Analyses of 115 Selected MS Signals from Hydrophilic Extracts. (A) Analysis of polar metabolites of LA1777. (B) Analysis of polar metabolites of LA 4024. Red, related to photosynthesis and starch formation; black, related to isoprenoid biosynthesis; blue, lipid; yellow, inositol polyphosphates. For abbreviations, see Supplemental Data Set 3. R2X[1]: cumulative sum of squares of the entire X explained by principal component 1. X = log-normalized peak heights relative to LA1777 leaf matter; Q2X(cum) = cumulative fraction of the total variation of X that can be predicted by principal component 1 for all of its x-variables (response variables: 1 = GT; 2 = leaves). Mutual predictability for both data sets was demonstrated in Supplemental Data Set 4.
Figure 4.
Figure 4.
MapMan Overview of the Transcriptomics of Cellular Metabolism in LA1777. The color scale (bottom right hand corner) corresponds to log2-fold changes for trichome versus trichome-free leaves with red being significantly overexpressed in trichomes and blue overexpressed in leaves (P < 0.05, Fisher exact t test). White squares: log2-fold changes between −1 and 1 or t test, P > 0.05.
Figure 5.
Figure 5.
Transcript Profiles of Genes Involved in Sucrose Degradation and Transport in Tomato Leaves and Trichomes. (A) Cell wall invertases. (B) Cytosolic invertases. (C) Cytosolic sucrose synthases. (D) Invertase inhibitors. (E) Plastidic invertases. (F) Sucrose symporter. Data presented are normalized fluorescence counts from the microarray data (see details in Supplemental Data Set 5). All leaf versus trichome differential expression within a species are significantly different (Student’s t test P < 0.05) except those annotated by an asterisk.
Figure 6.
Figure 6.
Distribution of the 2000 Most Highly Expressed Genes in Ontology Groups in Leaves, Trichomes, and Trichomes versus Leaves. (A) and (B) For leaves (A) and trichomes (B), the 2000 most highly expressed genes were grouped according to MapMan ontology. The categories that represent <2% of the cumulative expression of these 2000 genes were grouped together under “other.” (C) As in (B), except the 2000 top expressed genes are those with a fold change in expression of over 2 in GTs versus leaves. For detailed information, see Supplemental Data Set 5. All data are based on the average of n = 3 individual hybridizations per group.
Figure 7.
Figure 7.
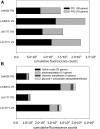
Cumulative Transcript Expression of Photosynthesis Genes. Light reactions (A) and carbon fixation and carbonic anhydrase (B). For details, see Supplemental Data Set 5.
Figure 8.
Figure 8.
Time Course after 13C-Pulse Labeling of LA1777 with 13C-CO2 and U13C-Glucose. 13C-CO2 (A) and U13C-Glucose in the presence of ambient CO2 (B). Blue: total pool sizes of 3-PGA, RU-1,5-BP, and sucrose normalized to sample dry weight. Red: fraction of carbon labeled in these metabolites. Error bars represent the average ± sd (n = 6). The fraction of labeled carbon represents the sum of all labeled C from all measured isotopologs. All the data have been corrected for the natural isotopic abundance of 13C-isotopes. Relative isotopolog abundances are presented in Supplemental Figure 8. Numbers above the red bars represent the relative 13C enrichment in the respective metabolites. Differences in the relative 13C-enrichment between leaf and trichome for a given time point are all significant based on heteroscedastic t tests (P < 0.05) unless indicated by an asterisk.
Figure 9.
Figure 9.
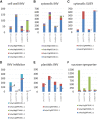
Expression Map of the Citrate-Malate-Pyruvate Shuttle in GTs Compared with Leaves. Log2-fold changes between trichomes and trichome-free leaves of LA1777, relative transcript expressions (left boxes) and relative protein abundances (right boxes). Red indicates significant (P < 0.05; t test) overexpression in trichomes, blue significant overexpression (P < 0.05; t test) in leaves, and white nonsignificant changes (P > 0.05; t test). The subcellular localization of the respective enzymes was manually checked using the software tools listed in Methods. The horizontal blue bar represents the mitochondrial envelope and the yellow discs with dark-blue circle the pyruvate-proton symporter (left) and the malate-citrate antiporter (right). cPK, cytosolic pyruvate kinase; cME, cytosolic malic enzyme; cMDH, cytosolic malate dehydrogenase; mMDH, mitochondrial malate dehydrogenase; mCS, mitochondrial citrate synthase; mPDH, mitochondrial pyruvate dehydrogenase.
Figure 10.
Figure 10.
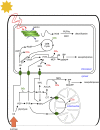
A Putative Model of Central Carbon and Energy Metabolism in Tomato GTs. A type VI glandular cell with its plasma membrane as a black line. The three main compartments involved (chloroplast, cytosol, and mitochondria) are indicated in blue. The yellow star represents the sun, which emits light of photosynthetically active wavelengths (λ). These allow the photosystems in thylakoid membranes (represented by stacks of green horizontal bars) to produce chemical energy (ATP) and reducing power (NADPH). Photosynthesis and metabolic activity are accompanied by the production of ROS, which are detoxified by PUFAs and glutathione. CO2 is in red in reactions where it is released and in green in reactions where it is fixed. Black arrows between metabolites represent either metabolic pathways or reactions that are discussed in detail in the main text. AcCoA, acetyl-CoA; C6, hexose; CIT, citrate; DMAPP, dimethylallyl diphosphate; GA3P, glyceraldehyde-3-phosphate; IPP, isopentenyl diphosphate; MAL, malate; OA, oxaloacetate; OPP, oxidative pentose phosphate pathway; Rib5P, ribulose-5-phosphate.

References

    1. Balcke G.U., Bennewitz S., Zabel S., Tissier A. (2014). Isoprenoid and metabolite profiling of plant trichomes. Methods Mol. Biol. 1153: 189–202. - PubMed
    1. Benjamini Y., Hochberg Y. (1995). Controlling the false discovery rate - a practical and powerful approach to multiple testing. J. R. Stat. Soc. B Met. 57: 289–300.
    1. Bergau N., Bennewitz S., Syrowatka F., Hause G., Tissier A. (2015). The development of type VI glandular trichomes in the cultivated tomato Solanum lycopersicum and a related wild species S. habrochaites. BMC Plant Biol. 15: 289. - PMC - PubMed
    1. Besser K., Harper A., Welsby N., Schauvinhold I., Slocombe S., Li Y., Dixon R.A., Broun P. (2009). Divergent regulation of terpenoid metabolism in the trichomes of wild and cultivated tomato species. Plant Physiol. 149: 499–514. - PMC - PubMed
    1. Bleeker P.M., Mirabella R., Diergaarde P.J., VanDoorn A., Tissier A., Kant M.R., Prins M., de Vos M., Haring M.A., Schuurink R.C. (2012). Improved herbivore resistance in cultivated tomato with the sesquiterpene biosynthetic pathway from a wild relative. Proc. Natl. Acad. Sci. USA 109: 20124–20129. - PMC - PubMed

MeSH terms