. 2017 Apr 13;7(1):885.
doi: 10.1038/s41598-017-01005-x.

Novel metrics to measure coverage in whole exome sequencing datasets reveal local and global non-uniformity

Affiliations

Novel metrics to measure coverage in whole exome sequencing datasets reveal local and global non-uniformity

Qingyu Wang et al. Sci Rep. .

Abstract

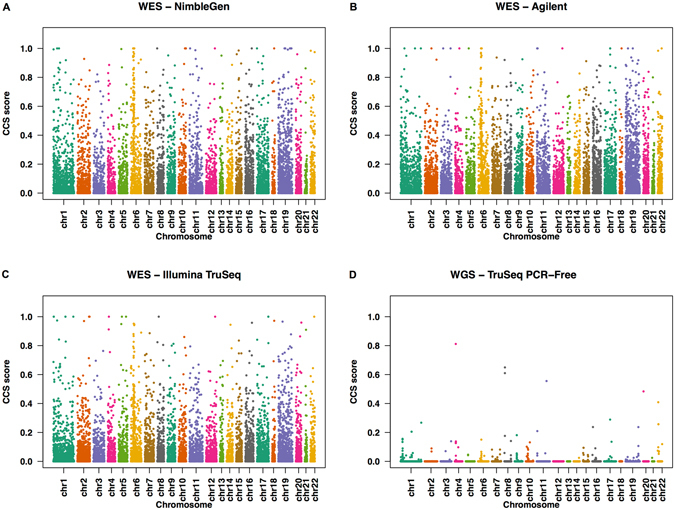
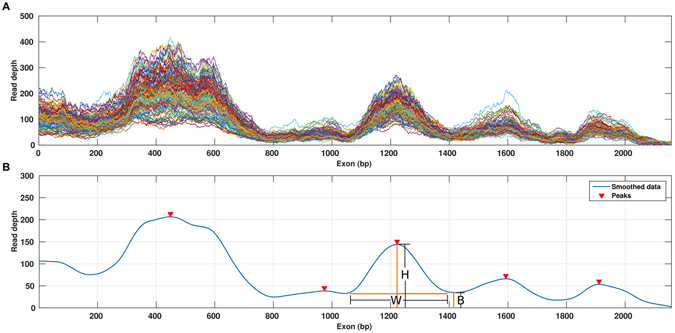
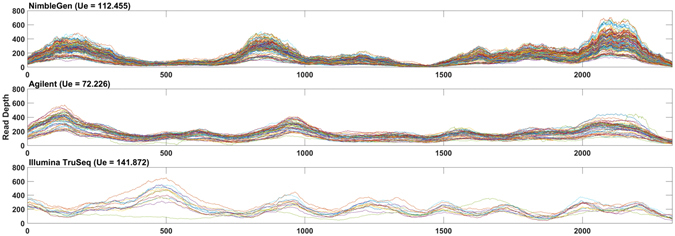
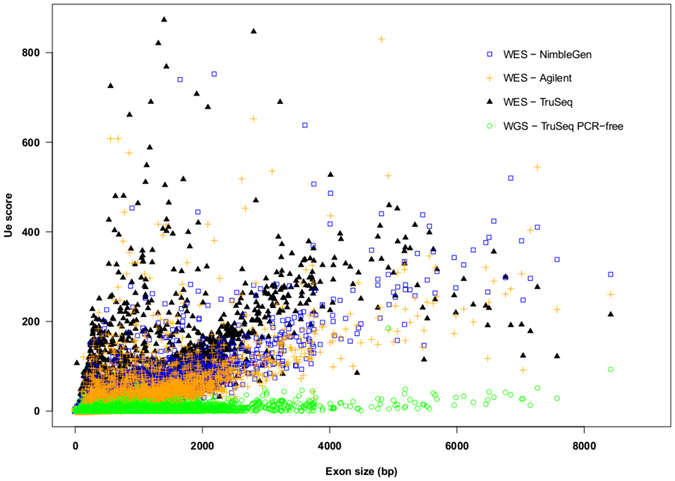
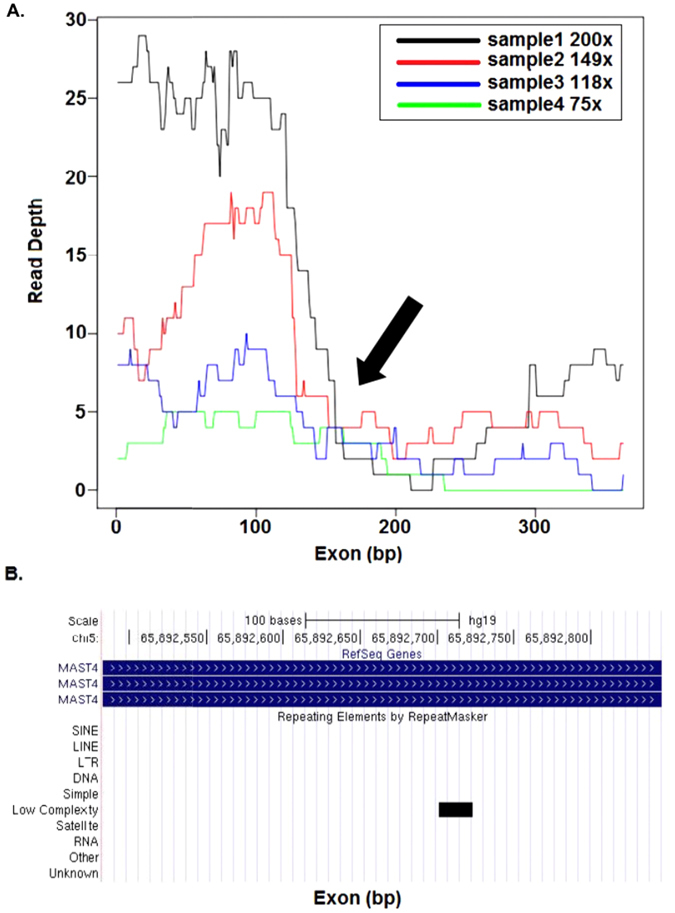
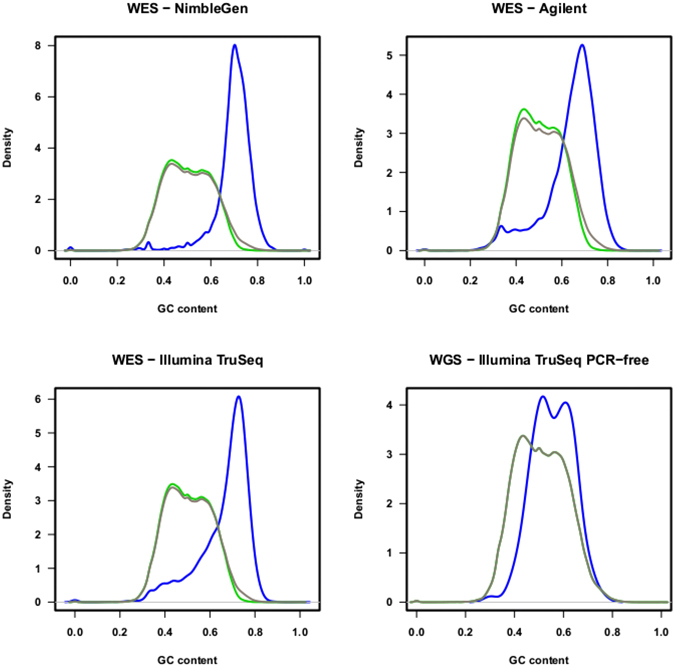
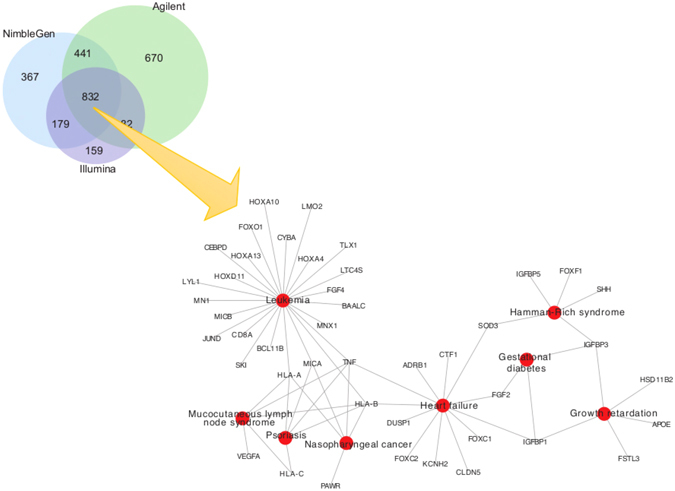
Whole Exome Sequencing (WES) is a powerful clinical diagnostic tool for discovering the genetic basis of many diseases. A major shortcoming of WES is uneven coverage of sequence reads over the exome targets contributing to many low coverage regions, which hinders accurate variant calling. In this study, we devised two novel metrics, Cohort Coverage Sparseness (CCS) and Unevenness (UE) Scores for a detailed assessment of the distribution of coverage of sequence reads. Employing these metrics we revealed non-uniformity of coverage and low coverage regions in the WES data generated by three different platforms. This non-uniformity of coverage is both local (coverage of a given exon across different platforms) and global (coverage of all exons across the genome in the given platform). The low coverage regions encompassing functionally important genes were often associated with high GC content, repeat elements and segmental duplications. While a majority of the problems associated with WES are due to the limitations of the capture methods, further refinements in WES technologies have the potential to enhance its clinical applications.


Conflict of interest statement

The authors declare that they have no competing interests.

Figures

Figure 1
Figure 1
CCS scores of targeted RefSeq genes along the whole chromosome in WES and WGS datasets. The CCS values are plotted along the length of each chromosome in a modified Manhattan Plot for WES datasets obtained from (A) NimbleGen, (B) Agilent, (C) Illumina TruSeq, and (D) WGS dataset from 1000 Genomes project.
Figure 2
Figure 2
Characterizing the coverage distribution with the Unevenness (UE) score. (A) The coverage distribution from multiple samples is plotted against the exon length. (B) The smoothed median coverage plotted against the exon length, obtained by first calculating median coverage for each position and then using LOWESS smoothing. Peaks and troughs were then identified by using a local optimization algorithm. Arrows indicate peaks identified in the curve: B, base, W, width and H, height of the peak, LR, length of the region analyzed.
Figure 3
Figure 3
Base coverage distribution along the length of the last coding exon of gene ZNF484 from WES datasets obtained from (A) NimbleGen, (B) Agilent, and (C) Illumina TruSeq.
Figure 4
Figure 4
Scatterplot of Unevenness (UE) scores against exon size in WES and WGS datasets.
Figure 5
Figure 5
Concurrence of repeat elements and coverage sparseness. (A) Base coverage distribution along the length of the first coding exon of MST4. WES samples from the NimbleGen platform with different average coverage ranging from 75X to 200X are shown in different colors. Arrow indicates the point at which coverage falls sharply. (B) UCSC browser screen shot of MST4 genomic region, black bar indicates the position of the repeat element.
Figure 6
Figure 6
The probability density curves showing GC content in sets of genes with different coverage. The distribution of GC content of all genes (black), high coverage genes with CCS score <0.2 (green), low coverage genes with CCS score >0.2 (blue) are represented.
Figure 7
Figure 7
Genes with low coverage in three different datasets. (A) Venn diagram showing number of low coverage genes (CCS score >0.2) across three different platforms. There are 832 genes with low coverage in common across all platforms. (B) Network diagram showing disease ontology analysis of the 832 low-coverage genes showing associations with leukemia, psoriasis, heart failure, and mucocutaneous lymph node syndrome.

References

    1. Hodges E, et al. Genome-wide in situ exon capture for selective resequencing. Nature genetics. 2007;39:1522–1527. doi: 10.1038/ng.2007.42. - DOI - PubMed
    1. Gilissen C, Hoischen A, Brunner HG, Veltman JA. Unlocking Mendelian disease using exome sequencing. Genome biology. 2011;12:228. doi: 10.1186/gb-2011-12-9-228. - DOI - PMC - PubMed
    1. Choi M, et al. Genetic diagnosis by whole exome capture and massively parallel DNA sequencing. Proceedings of the National Academy of Sciences of the United States of America. 2009;106:19096–19101. doi: 10.1073/pnas.0910672106. - DOI - PMC - PubMed
    1. Ng SB, et al. Targeted capture and massively parallel sequencing of 12 human exomes. Nature. 2009;461:272–276. doi: 10.1038/nature08250. - DOI - PMC - PubMed
    1. Gilissen C, Hoischen A, Brunner HG, Veltman JA. Disease gene identification strategies for exome sequencing. European journal of human genetics: EJHG. 2012;20:490–497. doi: 10.1038/ejhg.2011.258. - DOI - PMC - PubMed

Publication types

MeSH terms